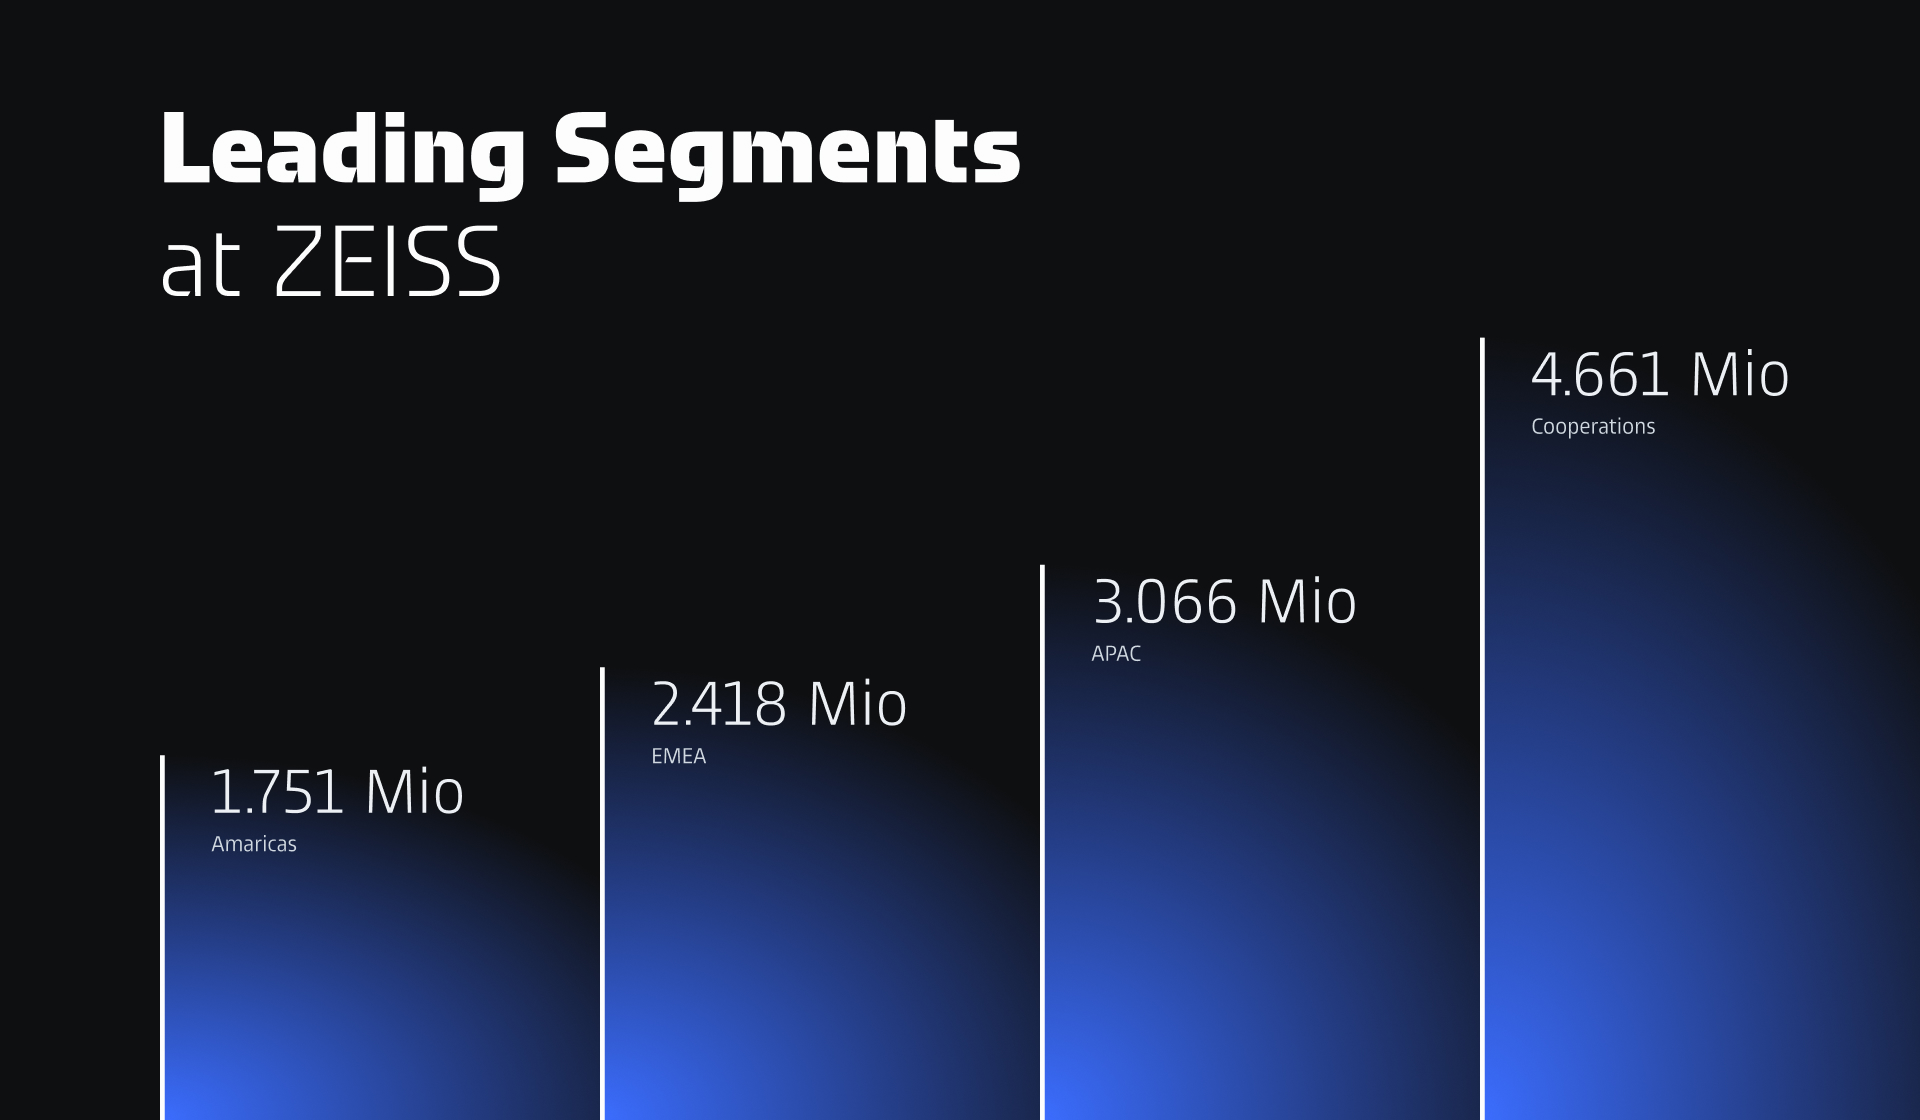
Expressive charts communicate the main message at a glance as part of a larger narrative. They combine clear data with distinctive shapes, contrast, and carefully applied effects.
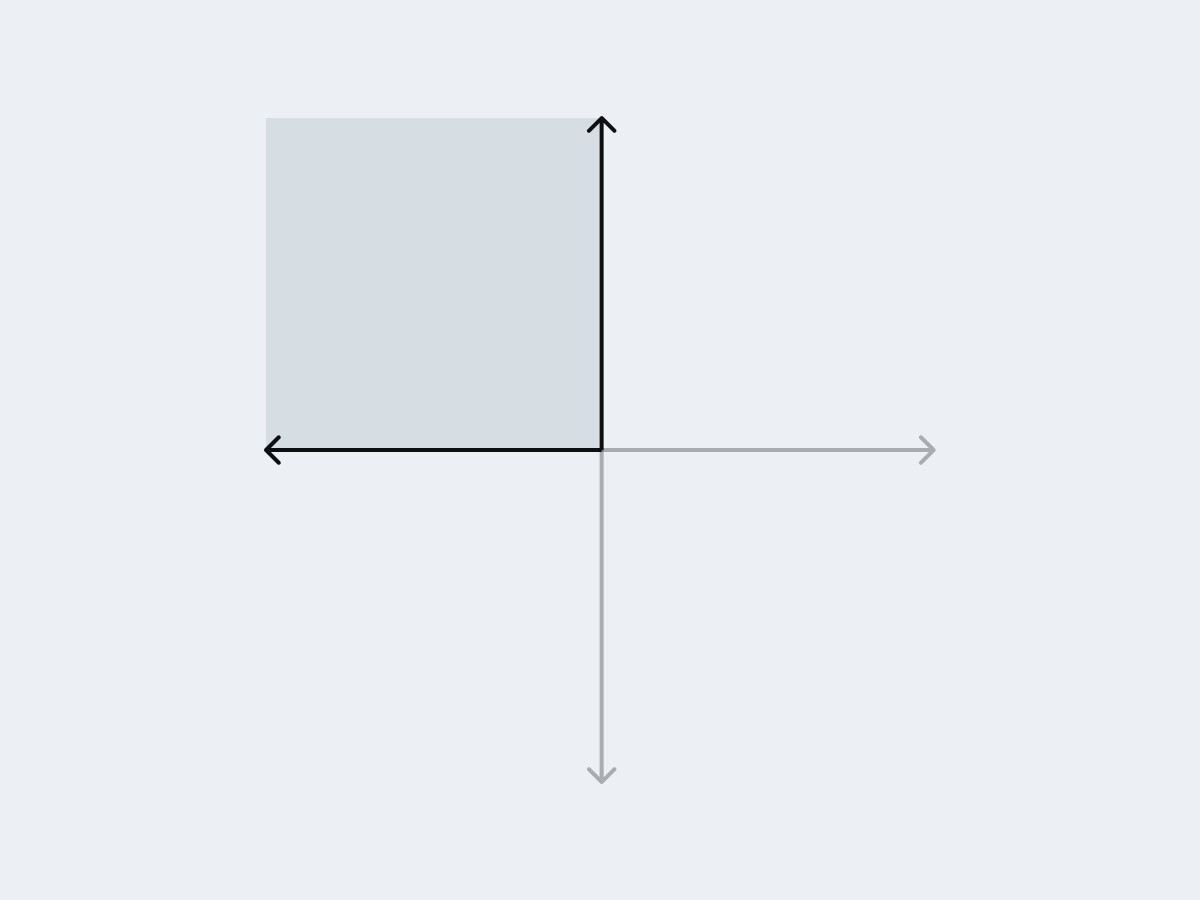
These compact charts communicate primarily through shapes and other visual elements. You see the message instantly; you do not need to search for information.
For best results, keep data points to a minimum and highlight one to convey the main message. Color, texture, glow, and distinctive details reflect the ZEISS Brand.


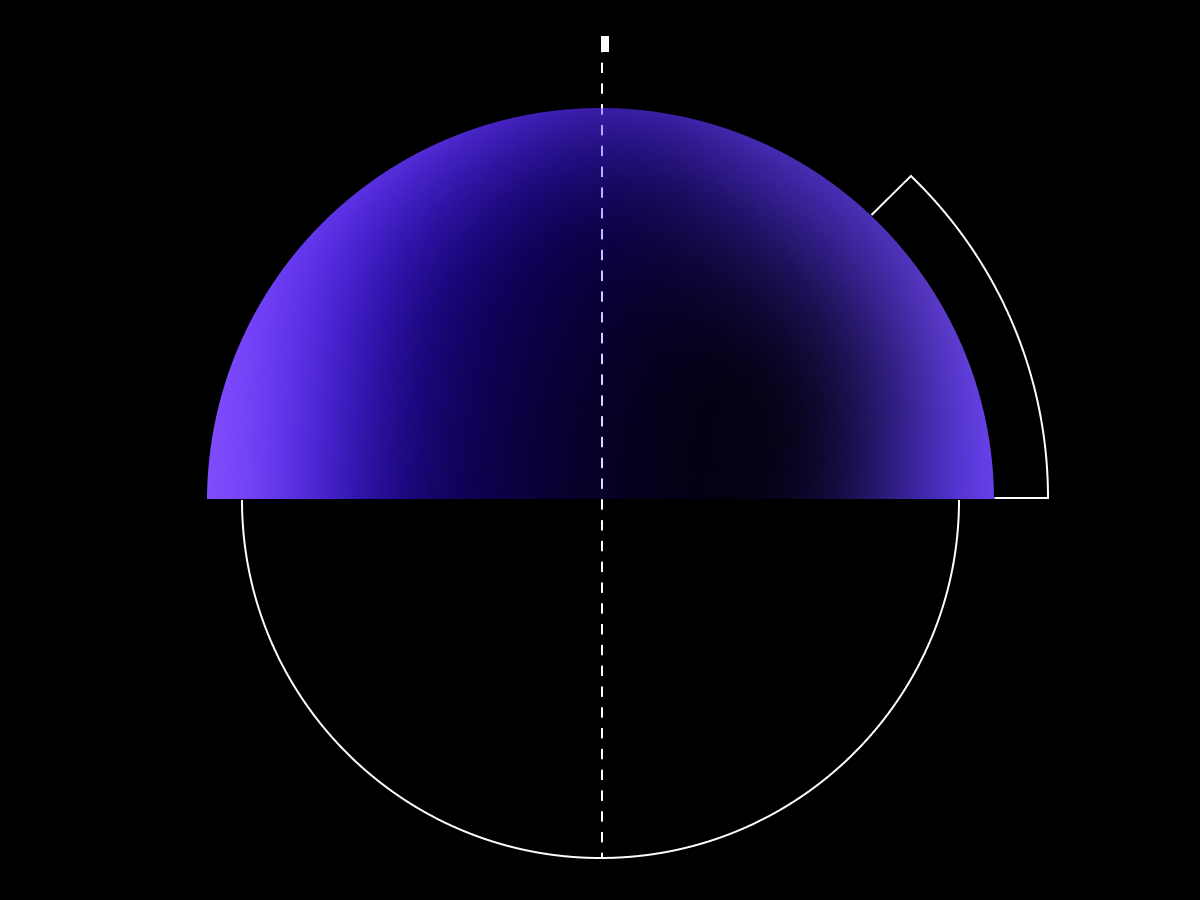
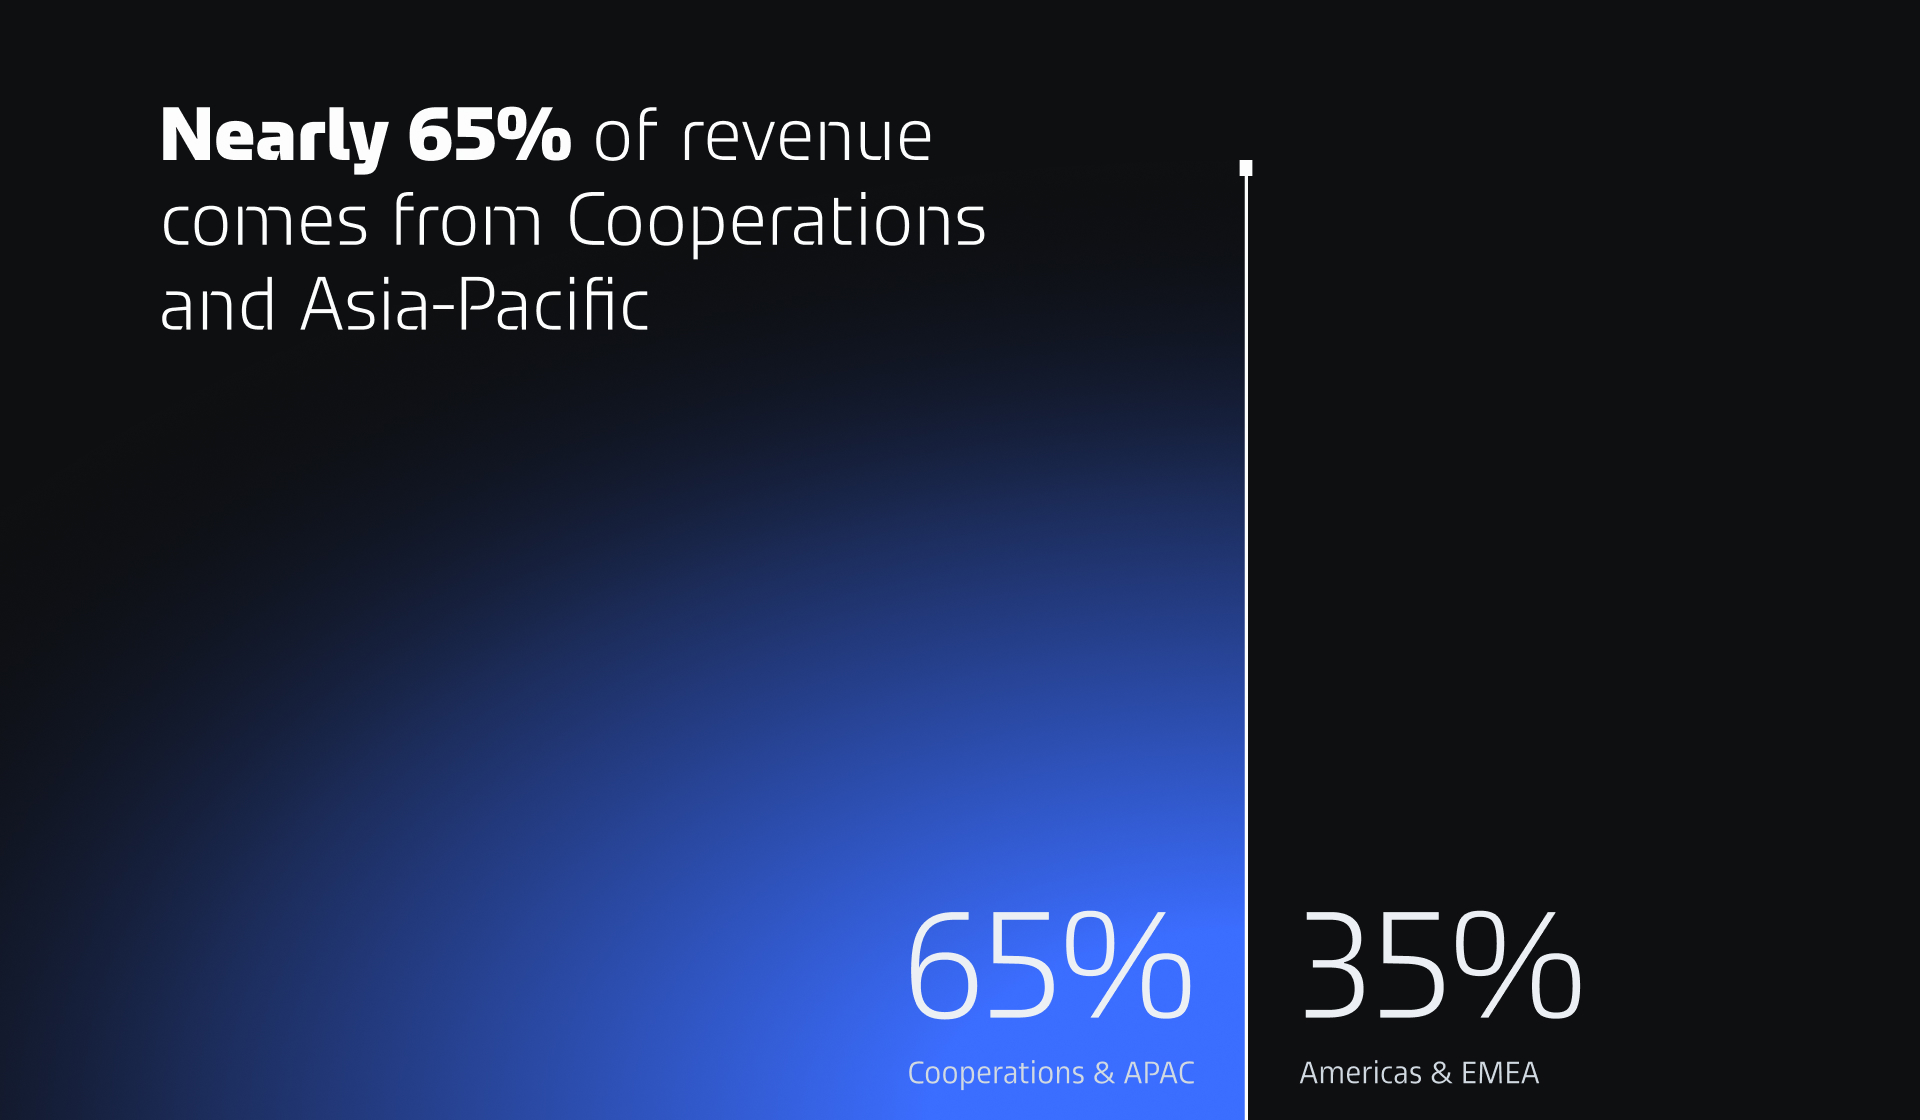
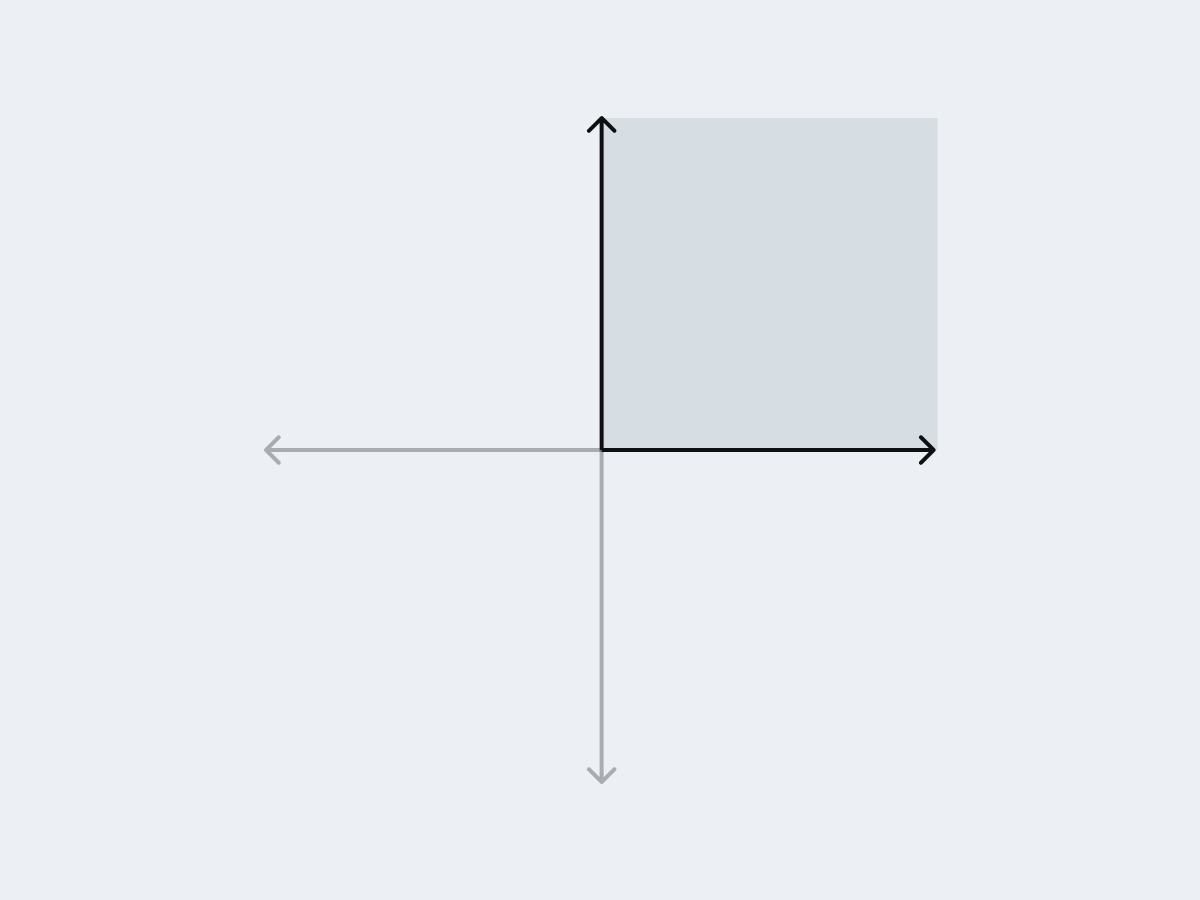
These charts build on expressive minimal charts, allowing for more visual elements, data points, and longer titles or explanatory text. They support a richer narrative while remaining easy to understand.
Highlight a focal point when emphasis is needed.

Corporate Brand, Communications & Public Affairs