We create charts inspired by optical technologies and physics, incorporating light and shadow, reflection, lasers, and the patterns and markers found in instruments and machinery. The resulting aesthetic is deliberately minimal and precise.
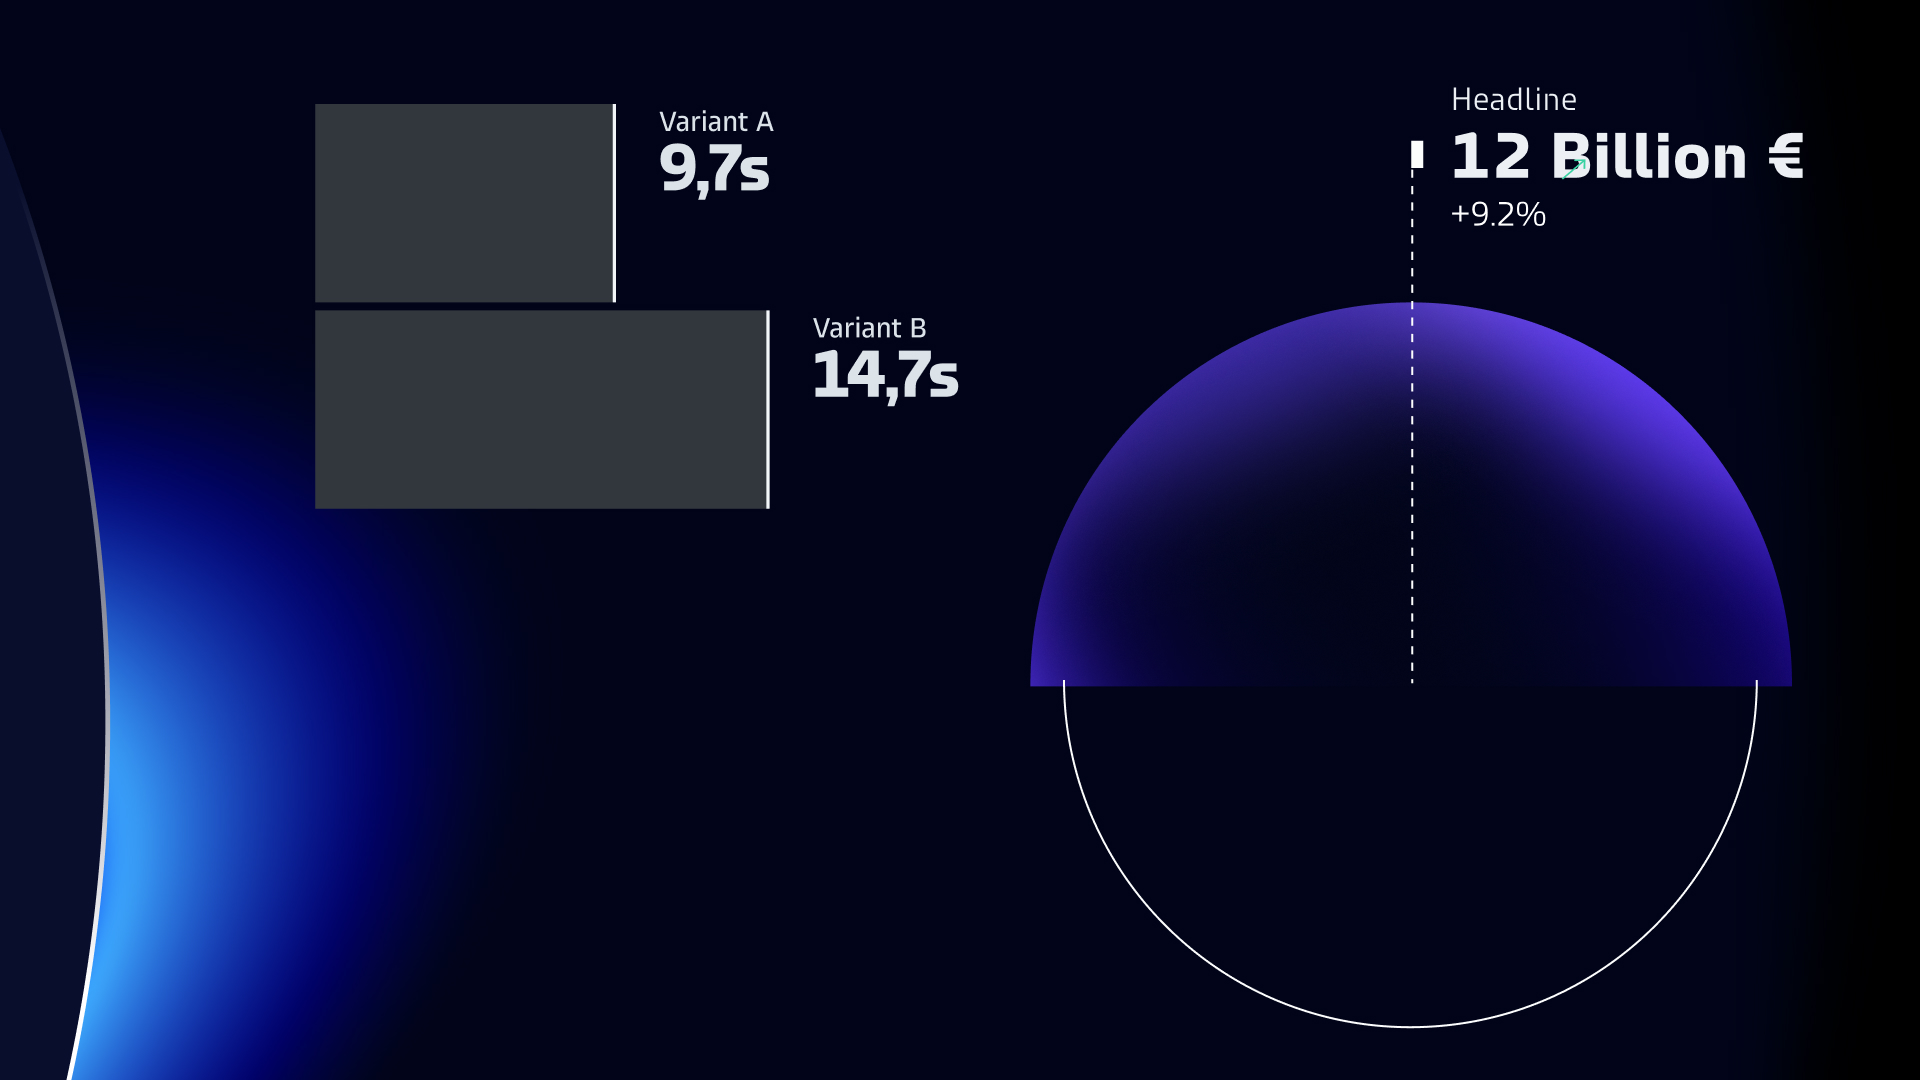
Data visualizations increase brand recognition and should be used intentionally.
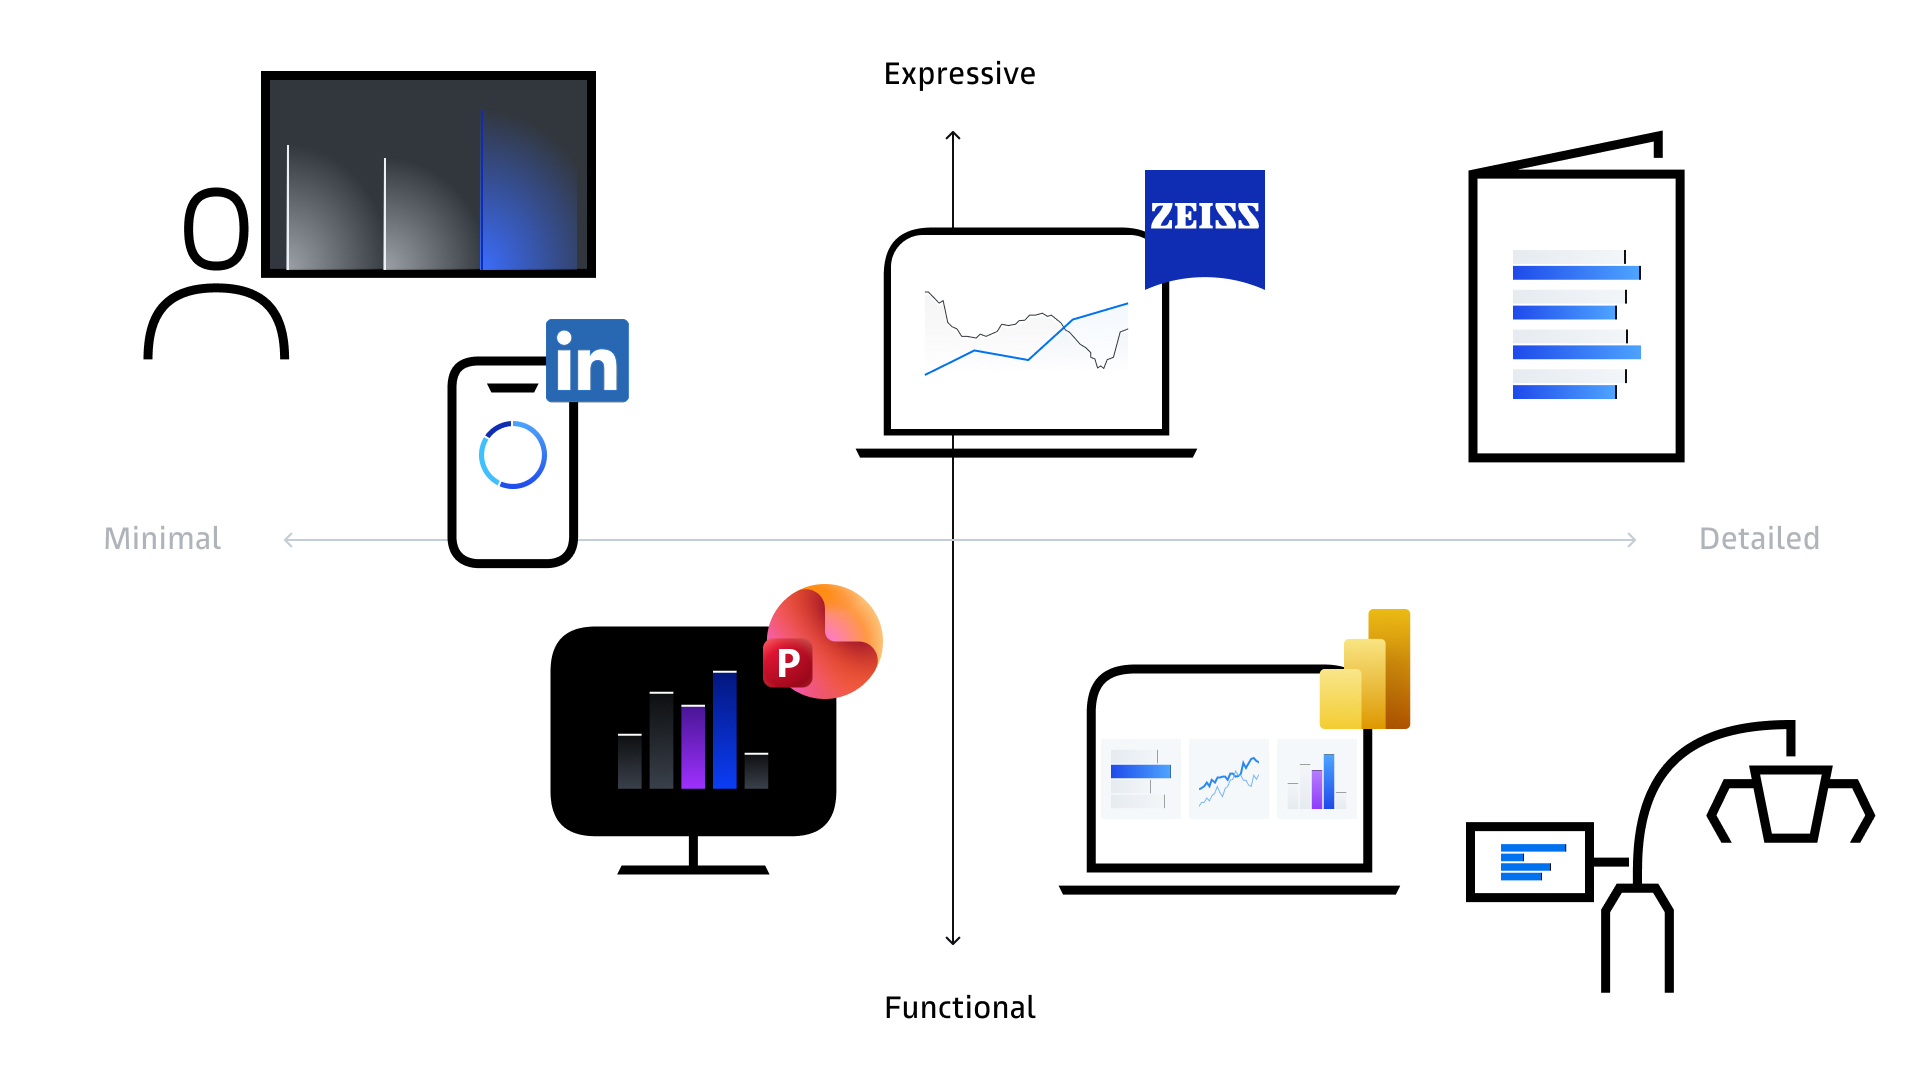
We differentiate between expressive and functional charts, each of which can be minimal or detailed.
Patterns and contrast are key to creating a distinctive appearance.
Our data visualizations meet technical and functional requirements.
总结
A conceptual framework gives you the flexibility you need within clear guardrails.
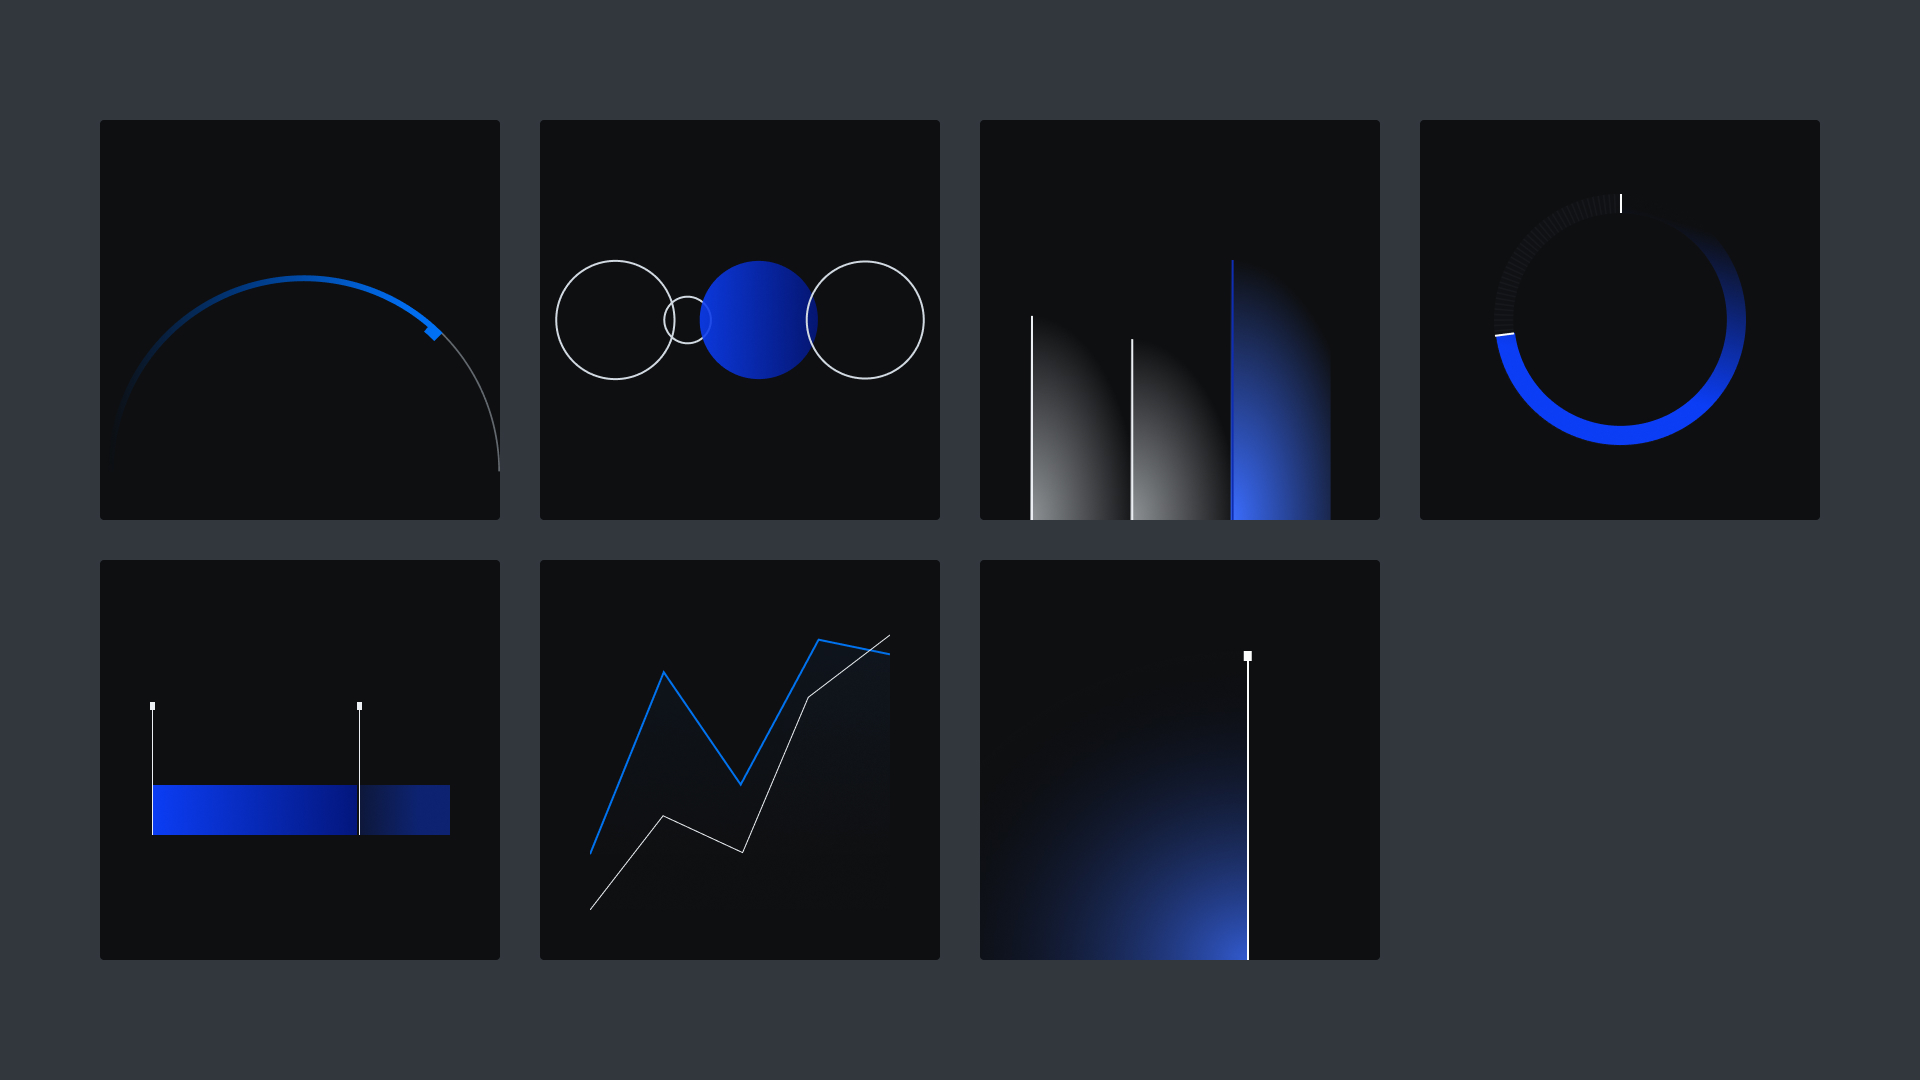
These compact charts are used as part of a larger narrative and communicate primarily through shapes and other visual elements. You see the message instantly; you do not need to search for information.
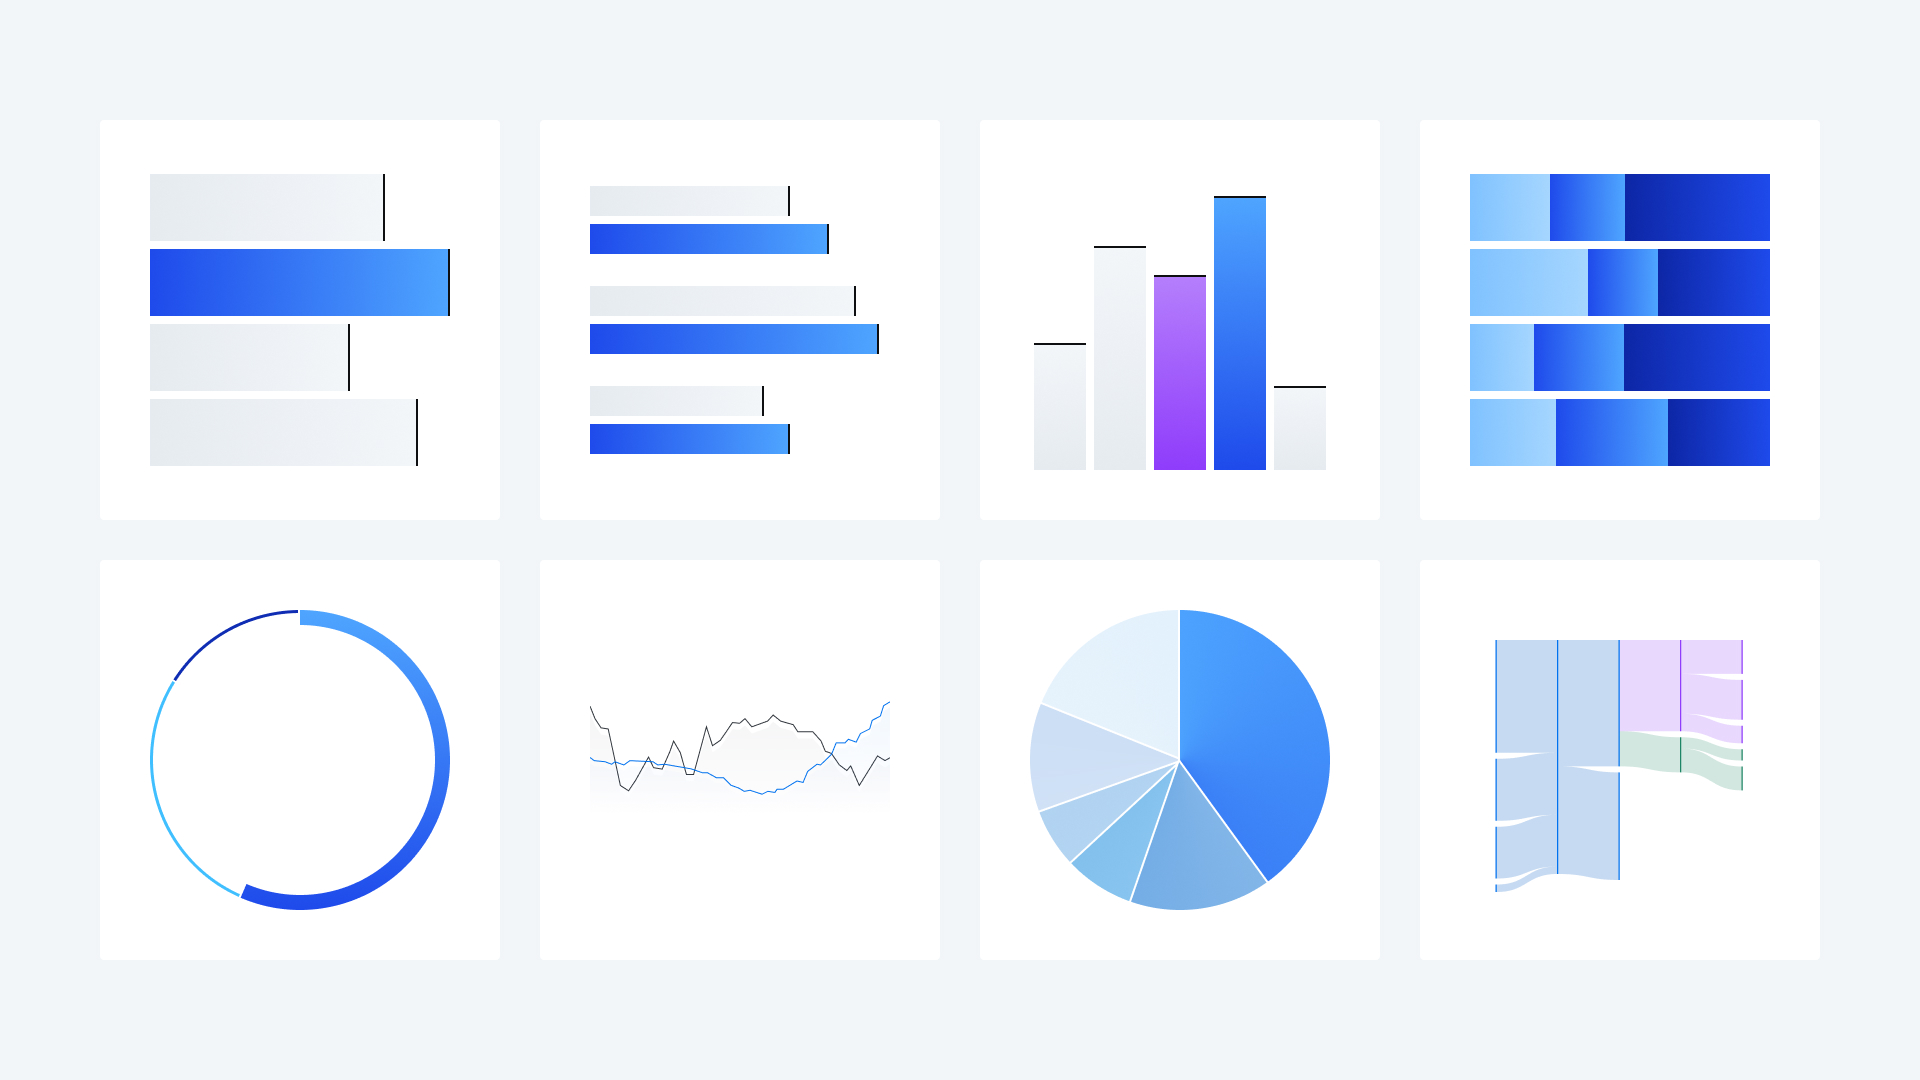
These charts contain all the information your audience needs. The focus is on the precision, completeness, and neutrality of the data.
Corporate Brand, Communications & Public Affairs