Before you start designing, define the visualization’s purpose and the message you want to send.
Keep your chart clean by focusing on the main message you want to communicate.
Use only essential elements and as few colors as possible.
Add details only to highlight key information or enhance emotional impact.
Use light and shadow when they add value.
Use contrast in line thickness deliberately.
The conceptual framework gives you the flexibility you need within clear guardrails.
Expressive conveys a core message instantly, without lengthy interpretation.
Functional supports charts requiring more granularity, and analytical rigor.
Minimal offers a clear, clean aesthetic that allows the data to stand on its own.
Detailed uses additional labels, textures, and effects to convey more information.
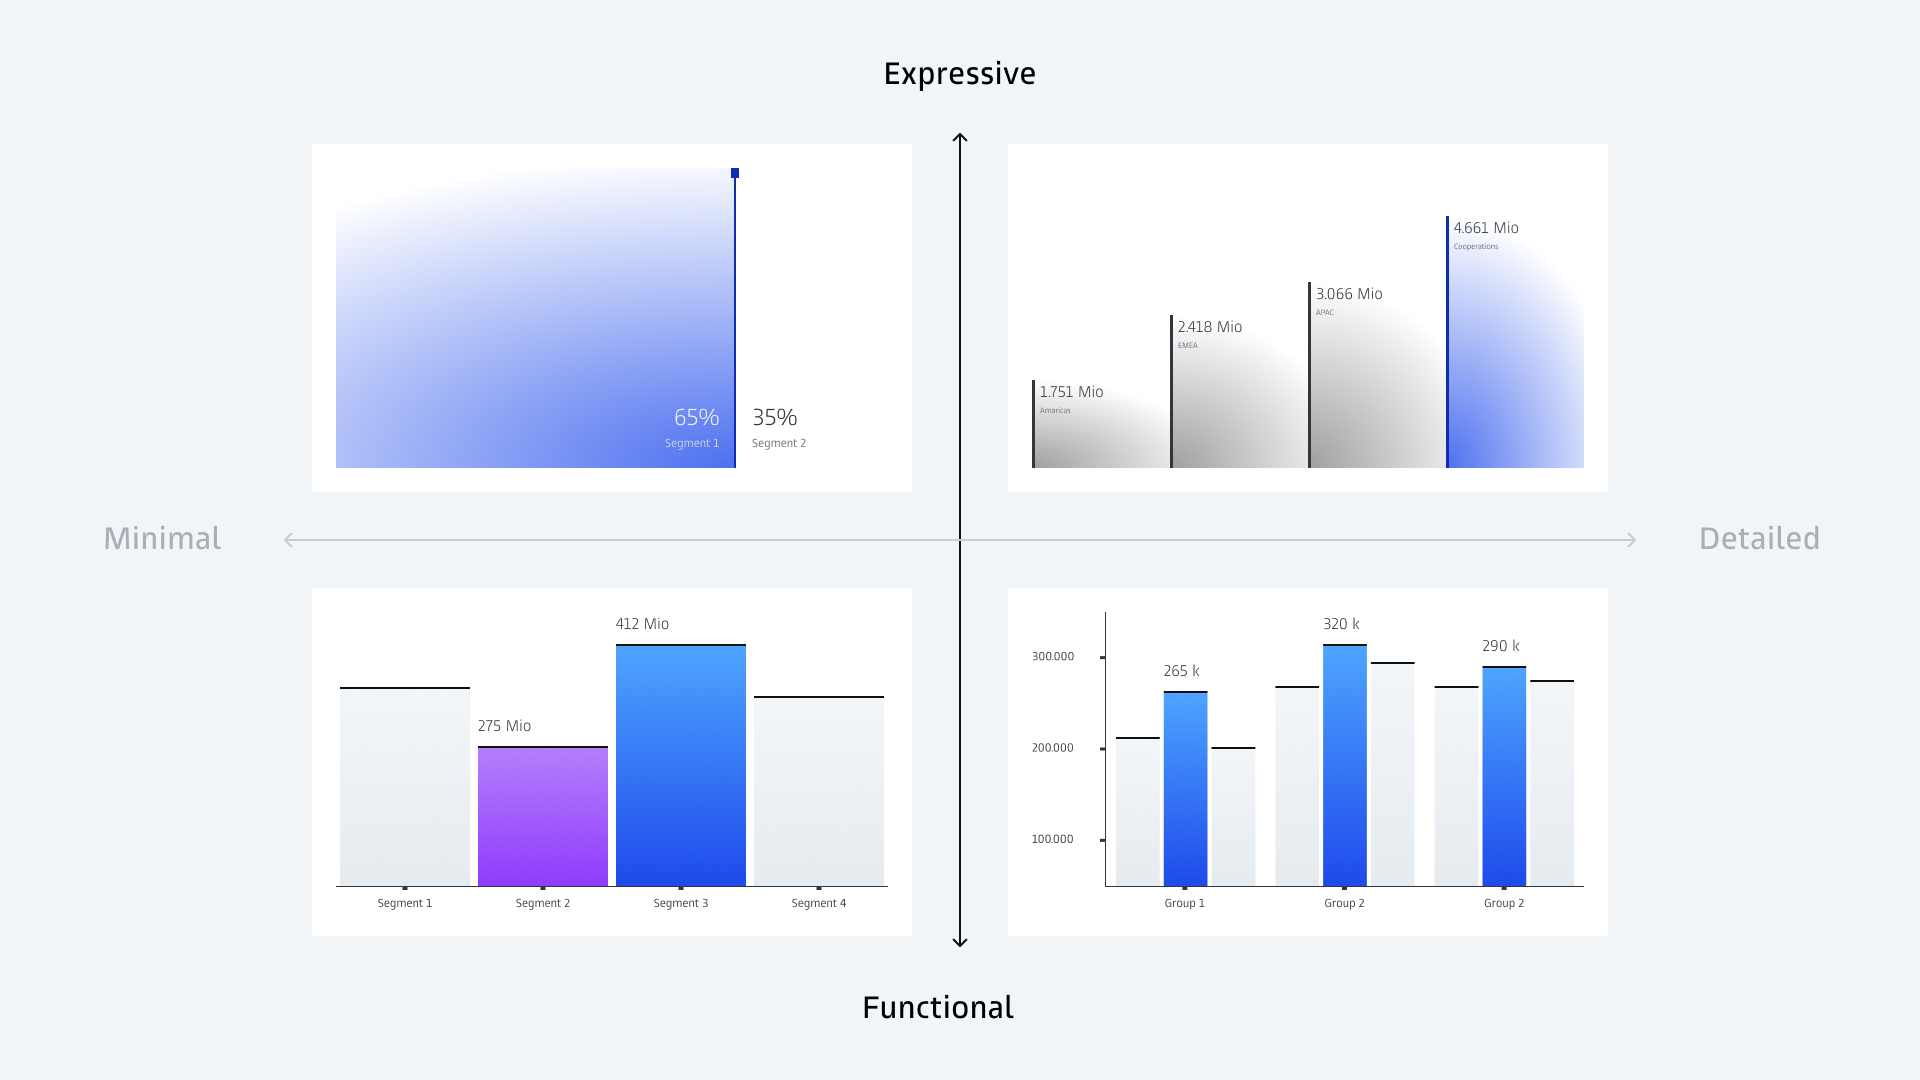
Design elements are applied with intention, not based on strict rules. Patterns, strokes, and thick/thin shapes can be used differently depending on the data and context. Some elements fit certain types of data better than others.
Chart elements follow the same principle: These can be adapted to your needs while remaining consistent with the overall design.

The interplay between bold surfaces and fine lines creates a distinctive, precise look.
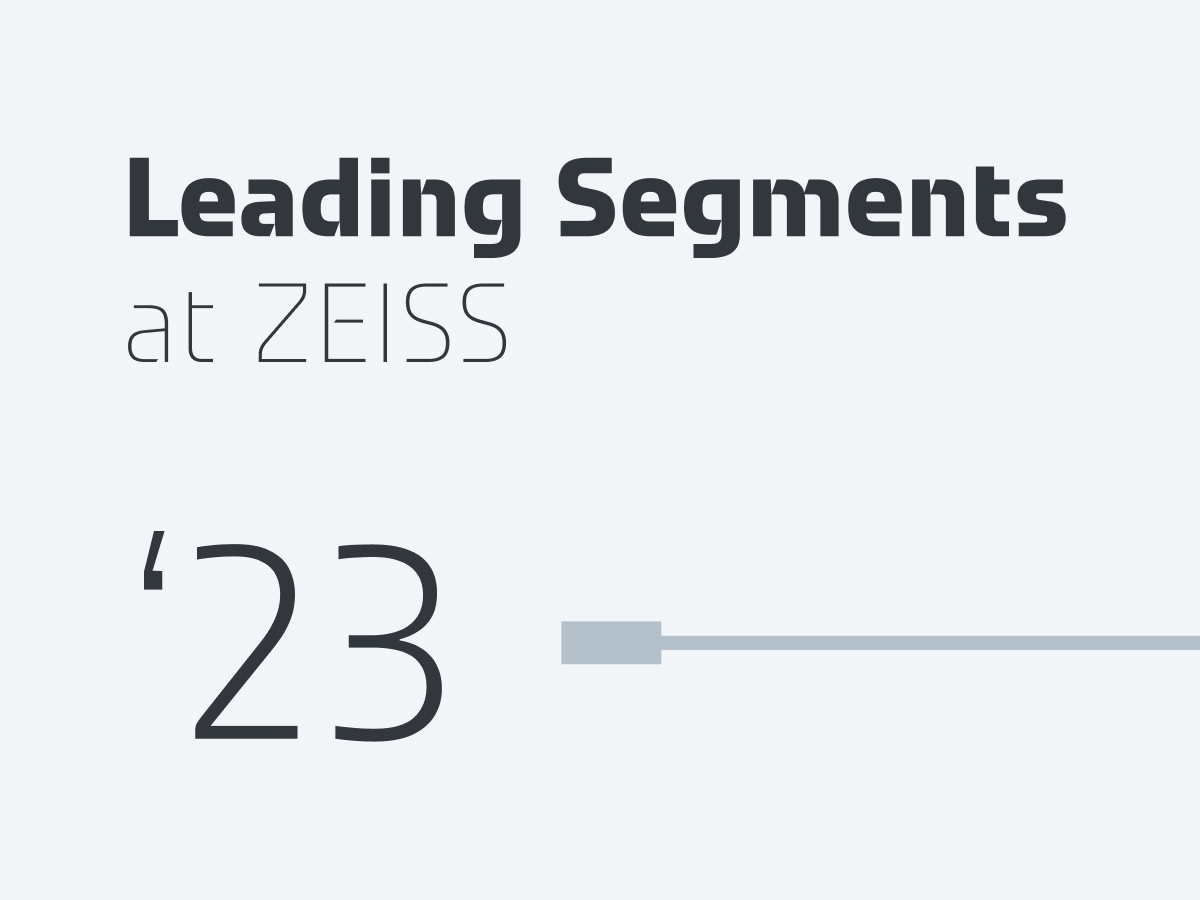
Our ZEISS Typeface further differentiates our data visualizations.
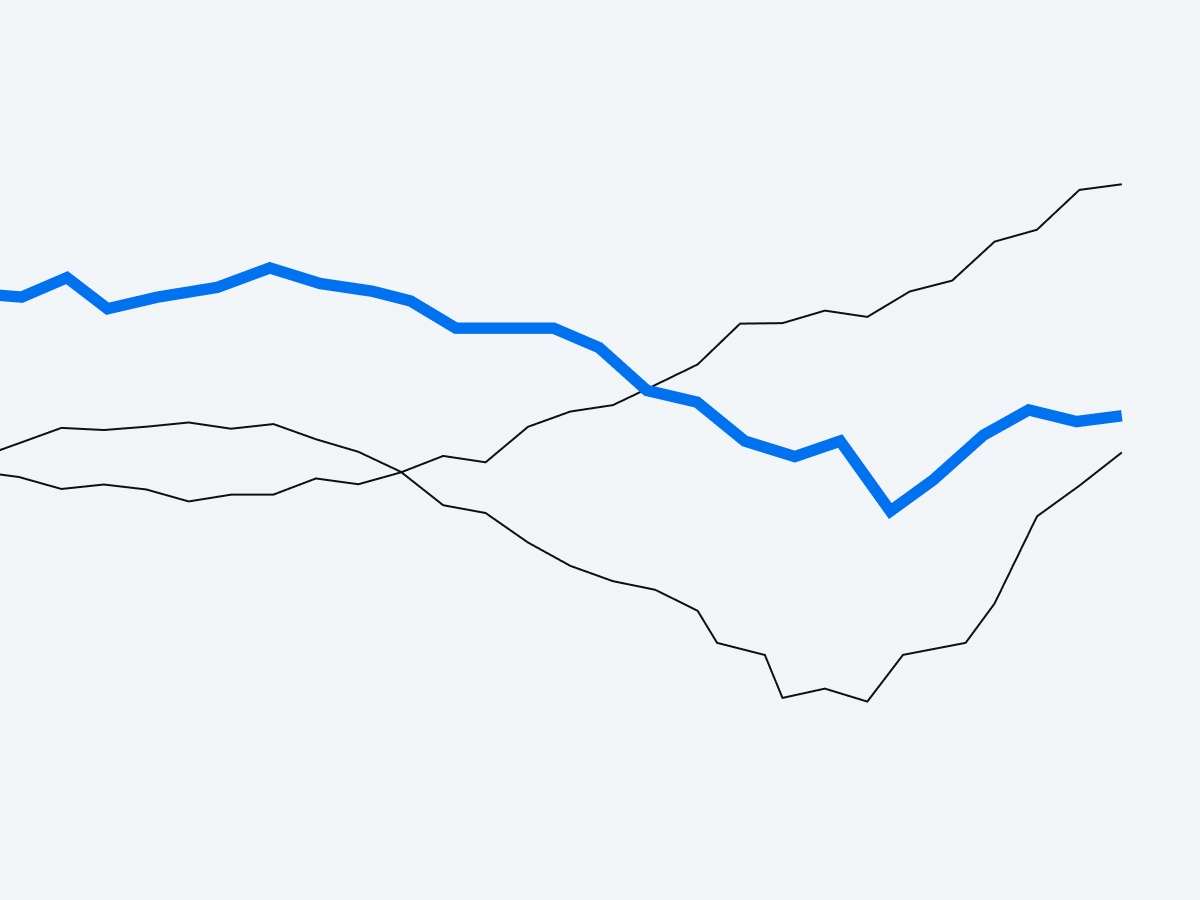
A clear, limited use of brand colors makes our data visualizations distinct. Add additional colors only if they help users grasp the data more quickly.

Used sparingly, subtle glow effects enhance dimensionality while keeping the design balanced and refined.

This is an alternative to outer glow effects and is easier to implement in certain tools such as PowerPoint or Power BI.

These create a distinctive look across touchpoints and underline precision.
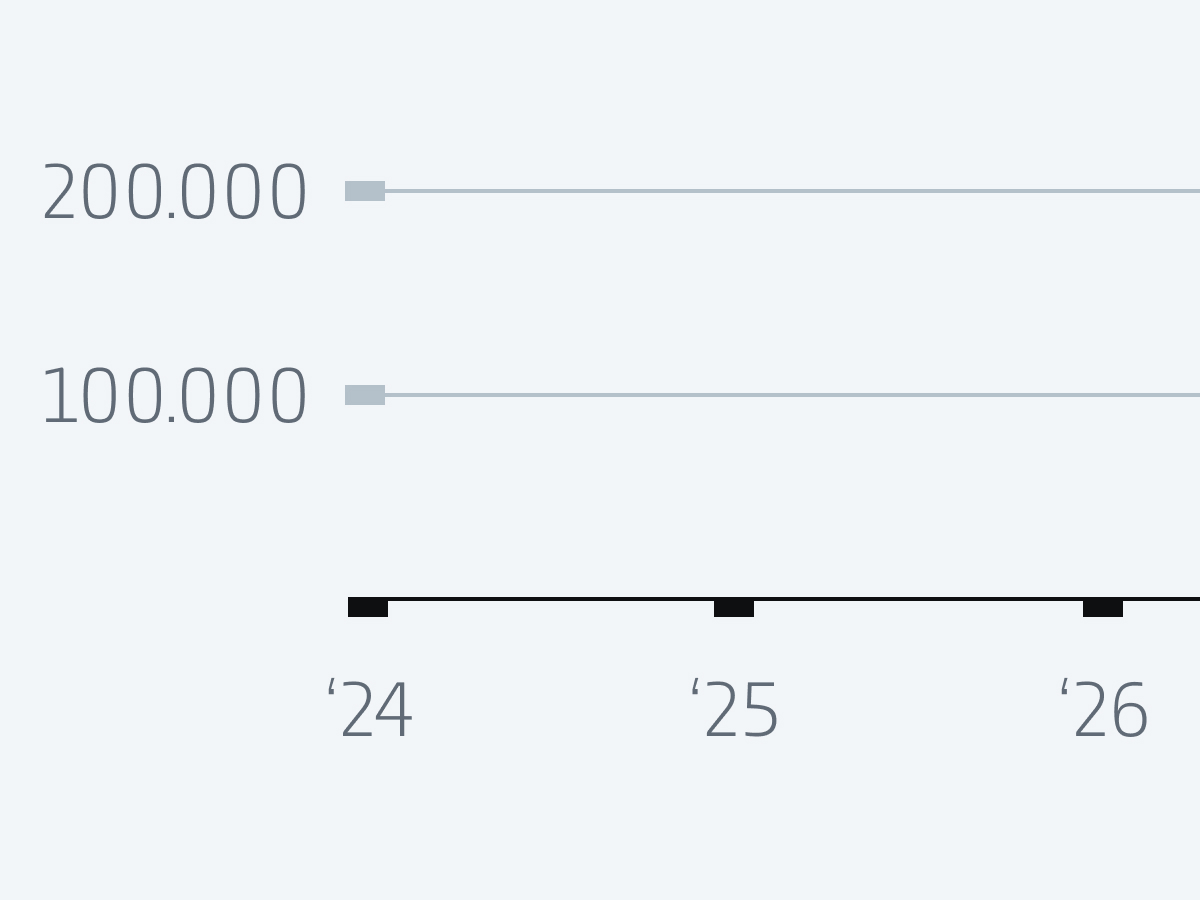
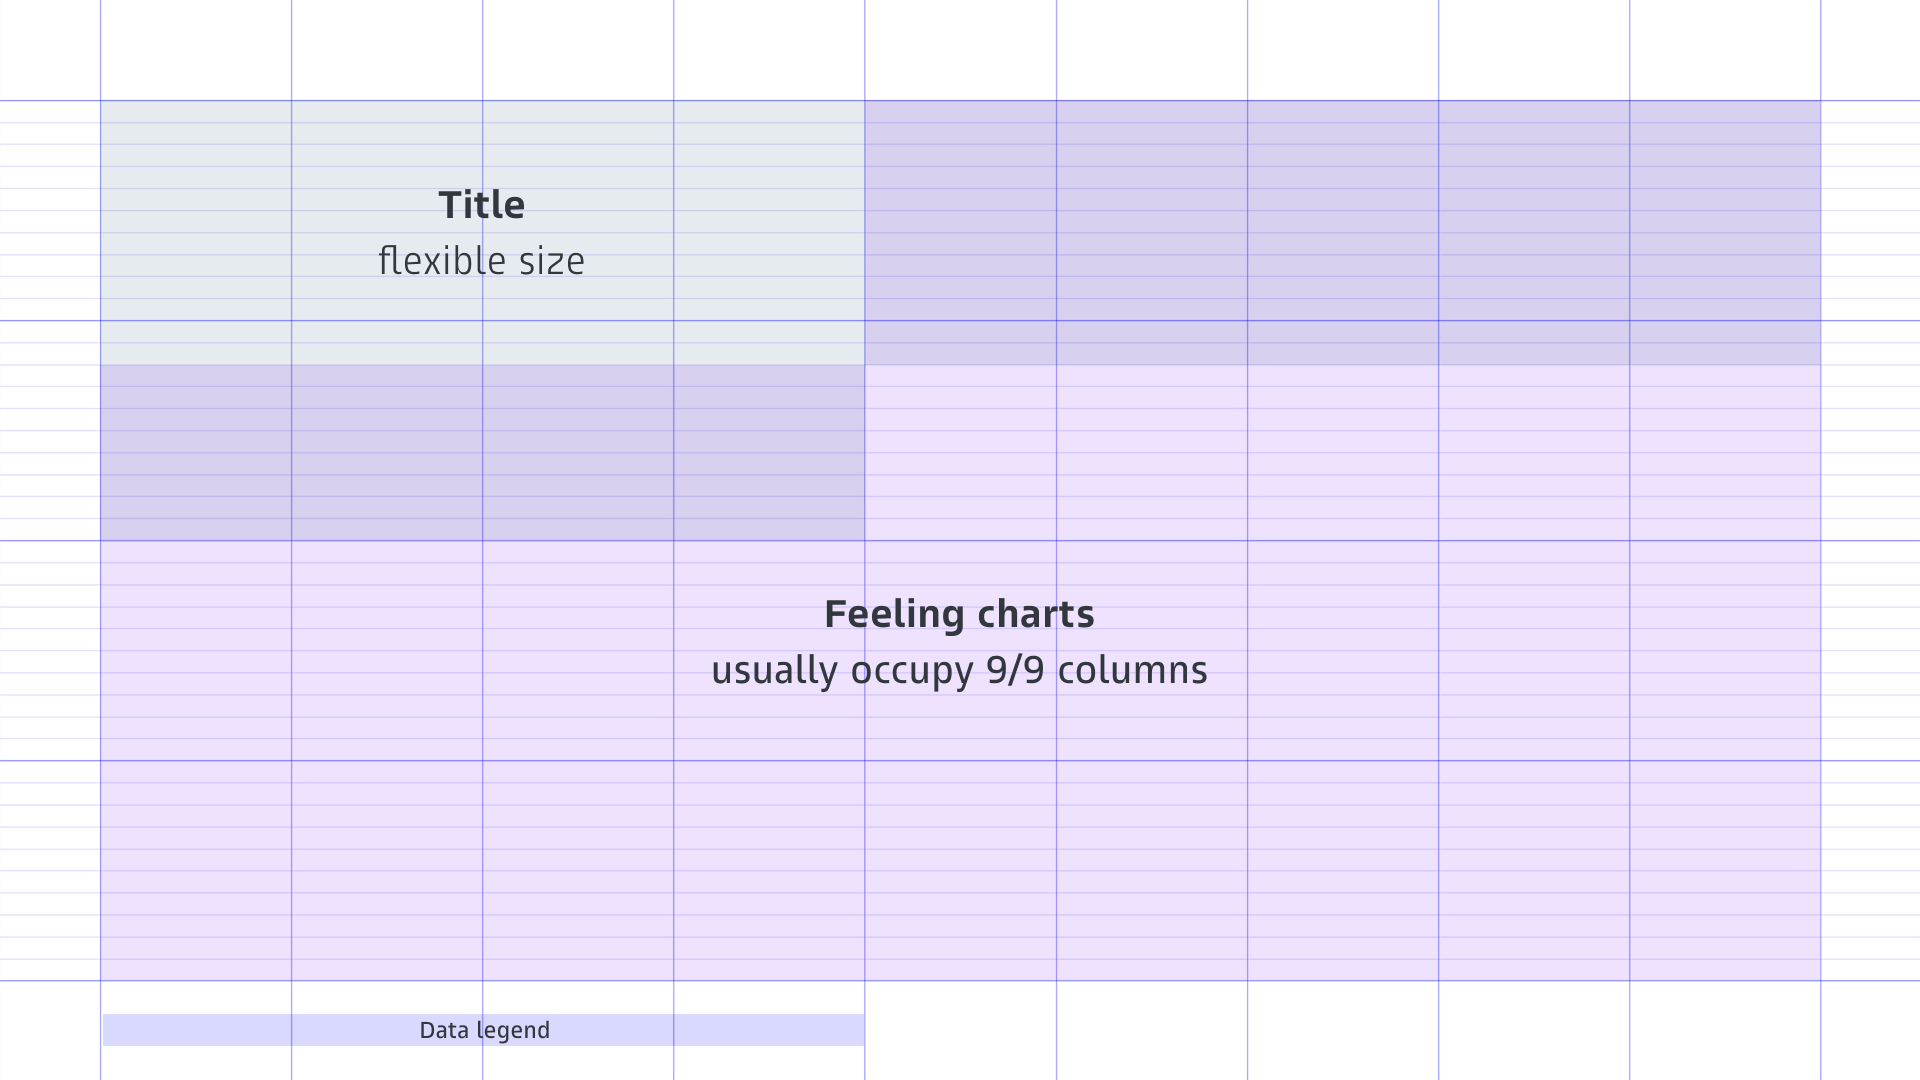
The grid should be used whenever the tools allow.
The grid provides a consistent structure for all charts. It ensures alignment, rhythm, and a clear hierarchy across different charts.
Titles and explanatory text are always positioned at the top left and data legends at the bottom left. This makes the charts easy to read and provides predictable reference points.
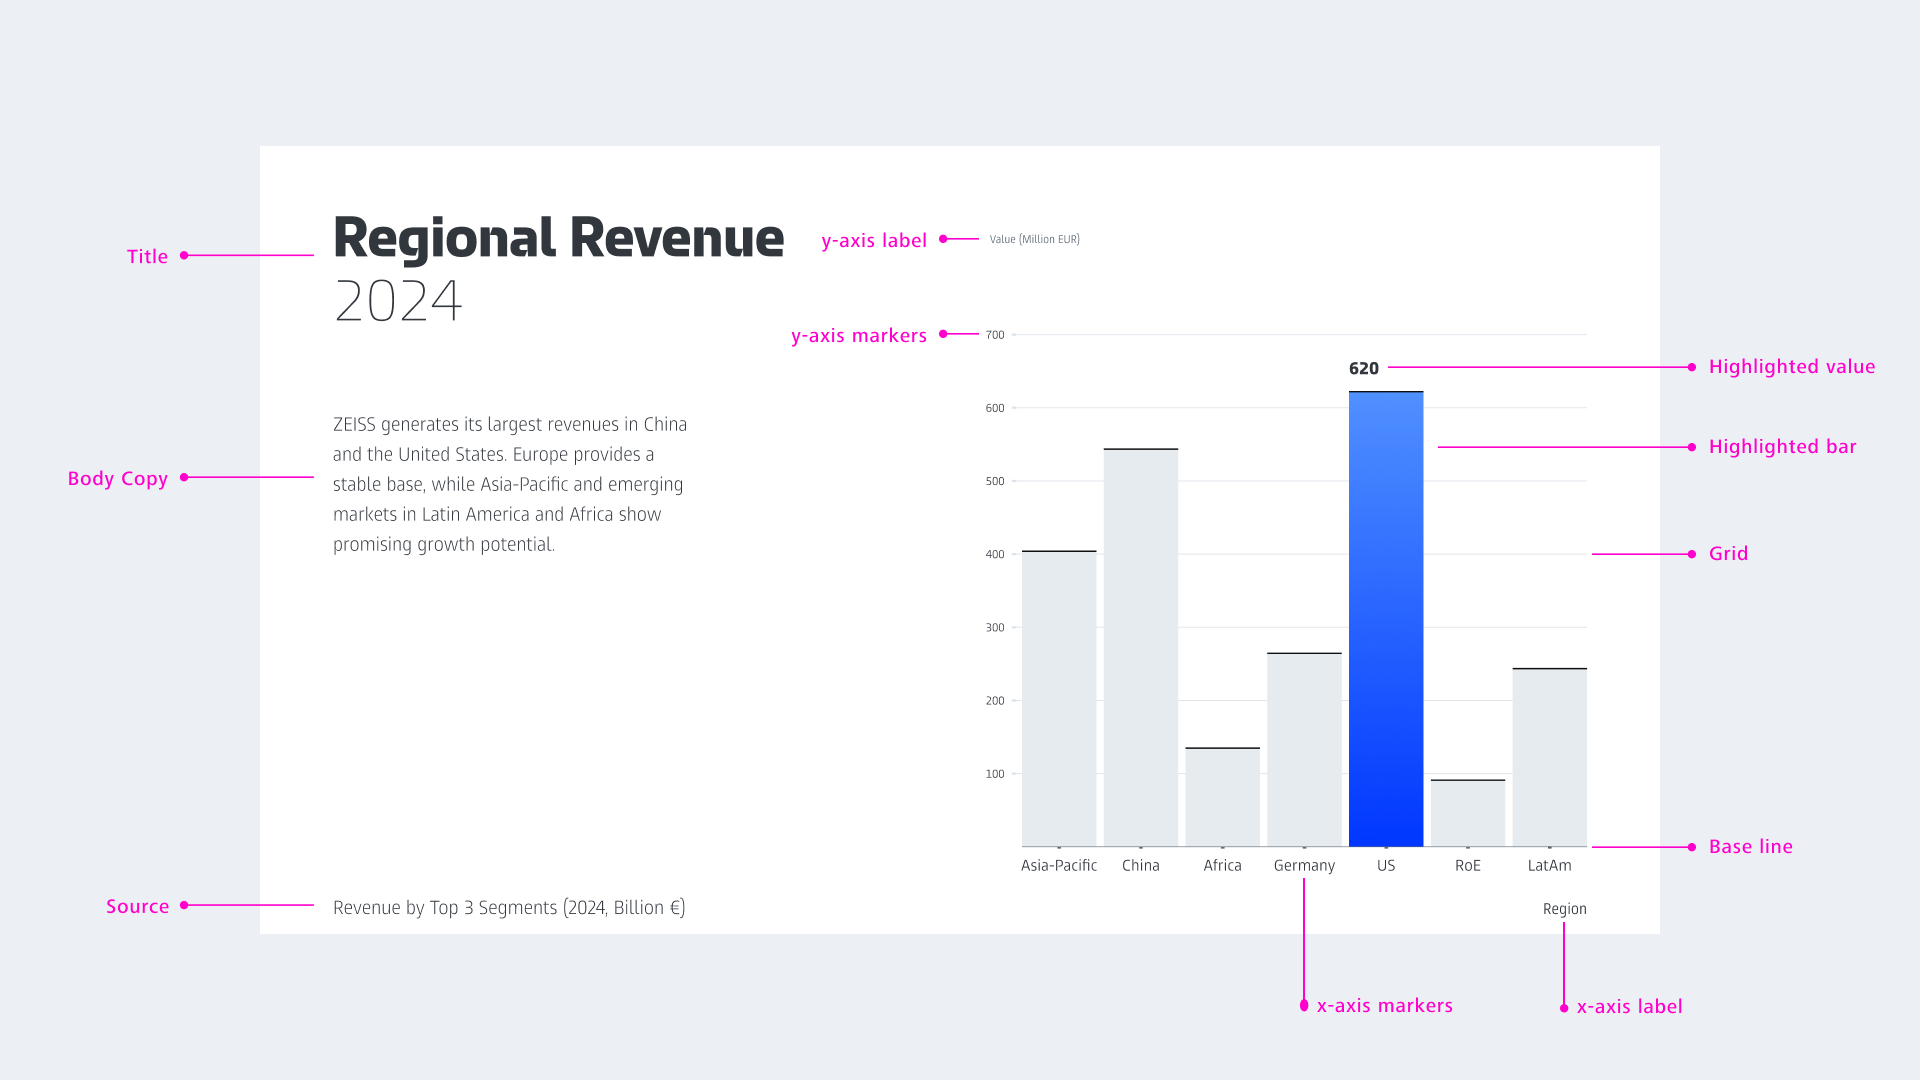
A consistent chart structure makes charts recognizable and easy to understand.
Corporate Brand, Communications & Public Affairs