Functional charts make data easy to read, compare, and interpret. They put the data front and center, using a restrained design that supports the information without distracting from it. From simple comparisons to detailed analysis, functional charts provide the labels, scales, and context needed to understand the data.
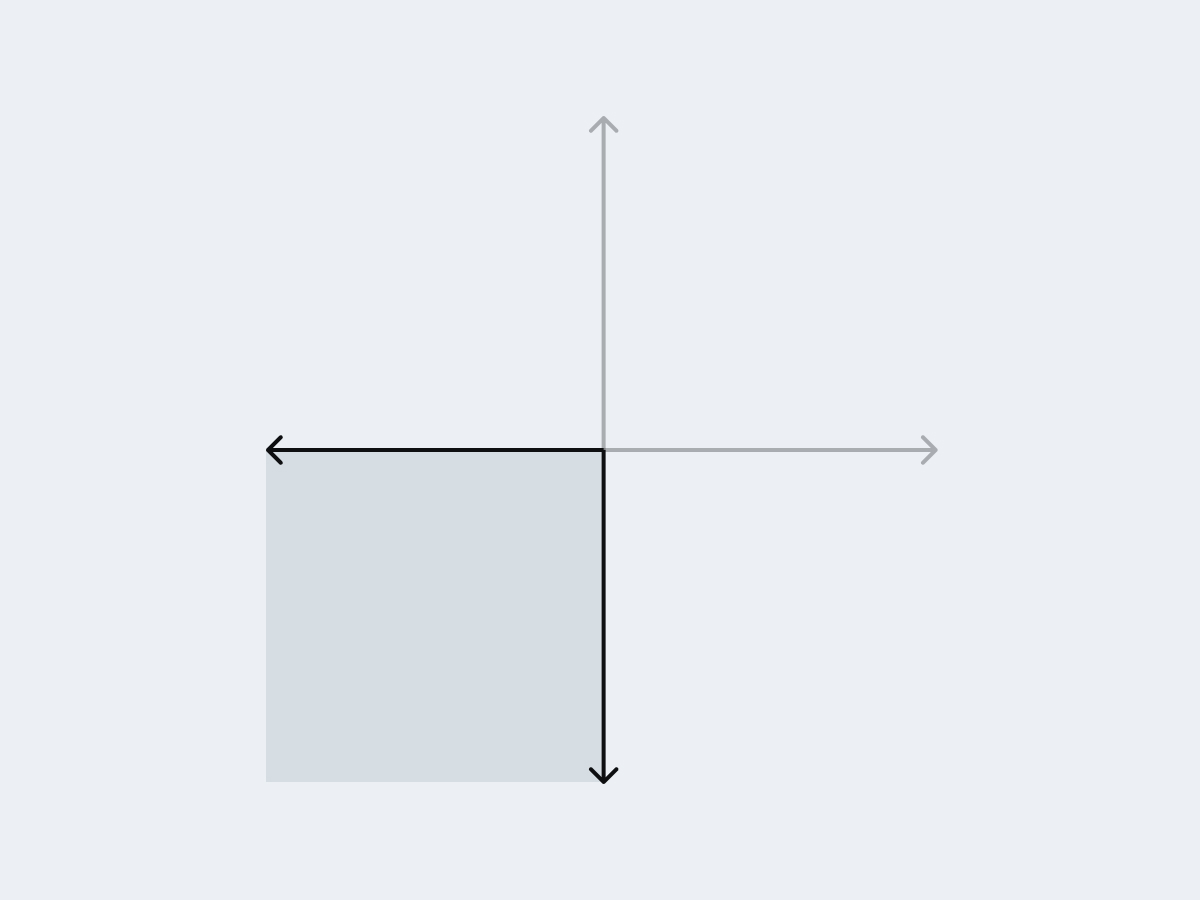
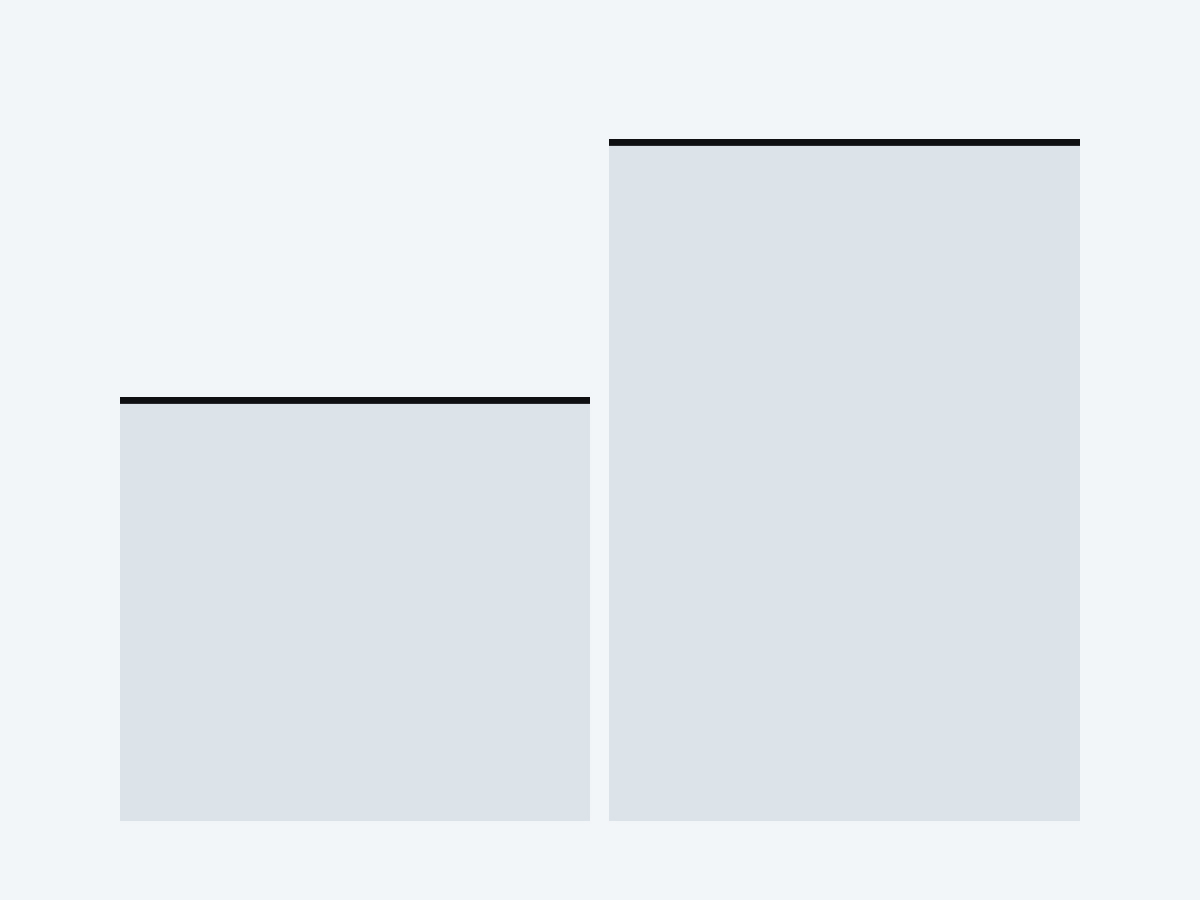
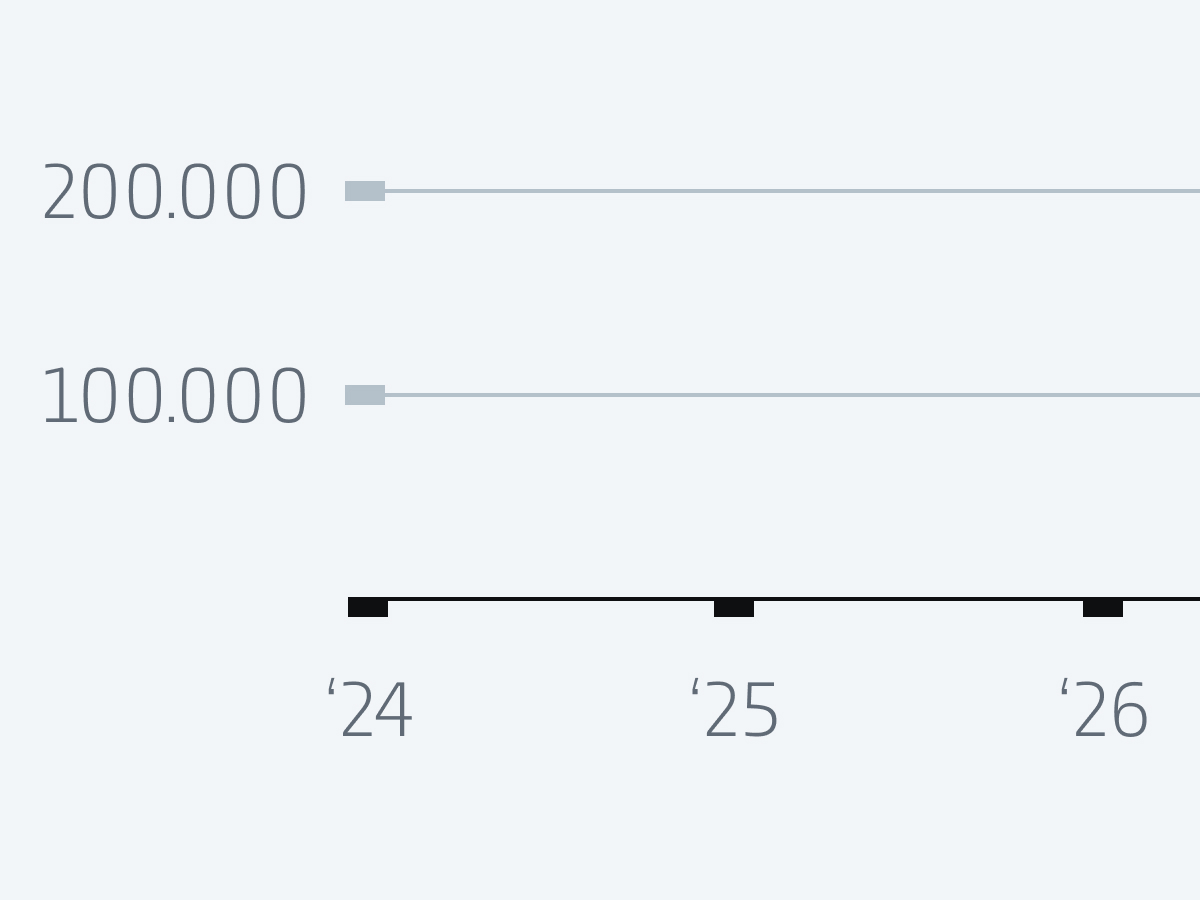
These compact charts present a small number of data points clearly and directly, communicating primarily through shapes and visuals. You see the message instantly; you do not need to search for information.
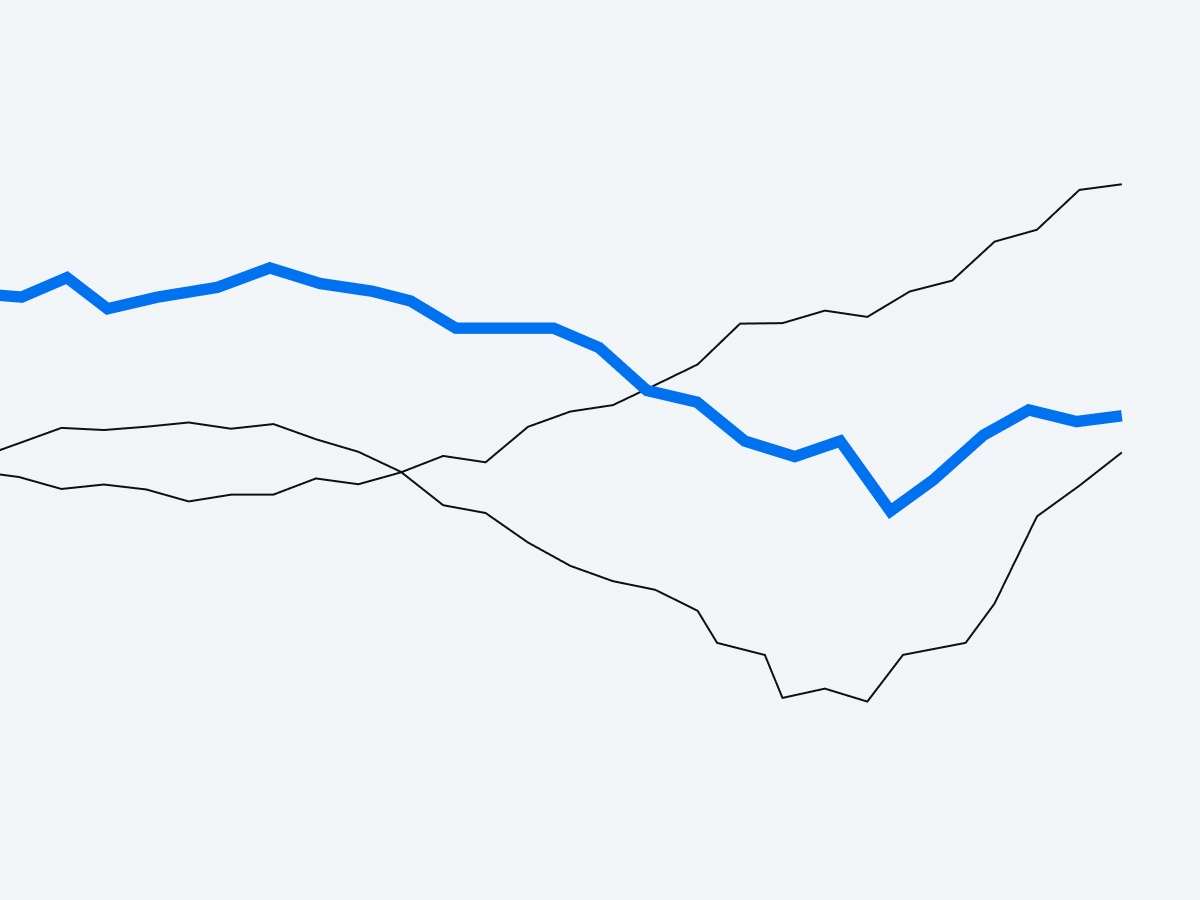
For best results, include only the data points needed for comparison and interpretation. If needed, highlight one data point to convey the main message. Color, texture, glow, and distinctive details reflect the ZEISS Brand.

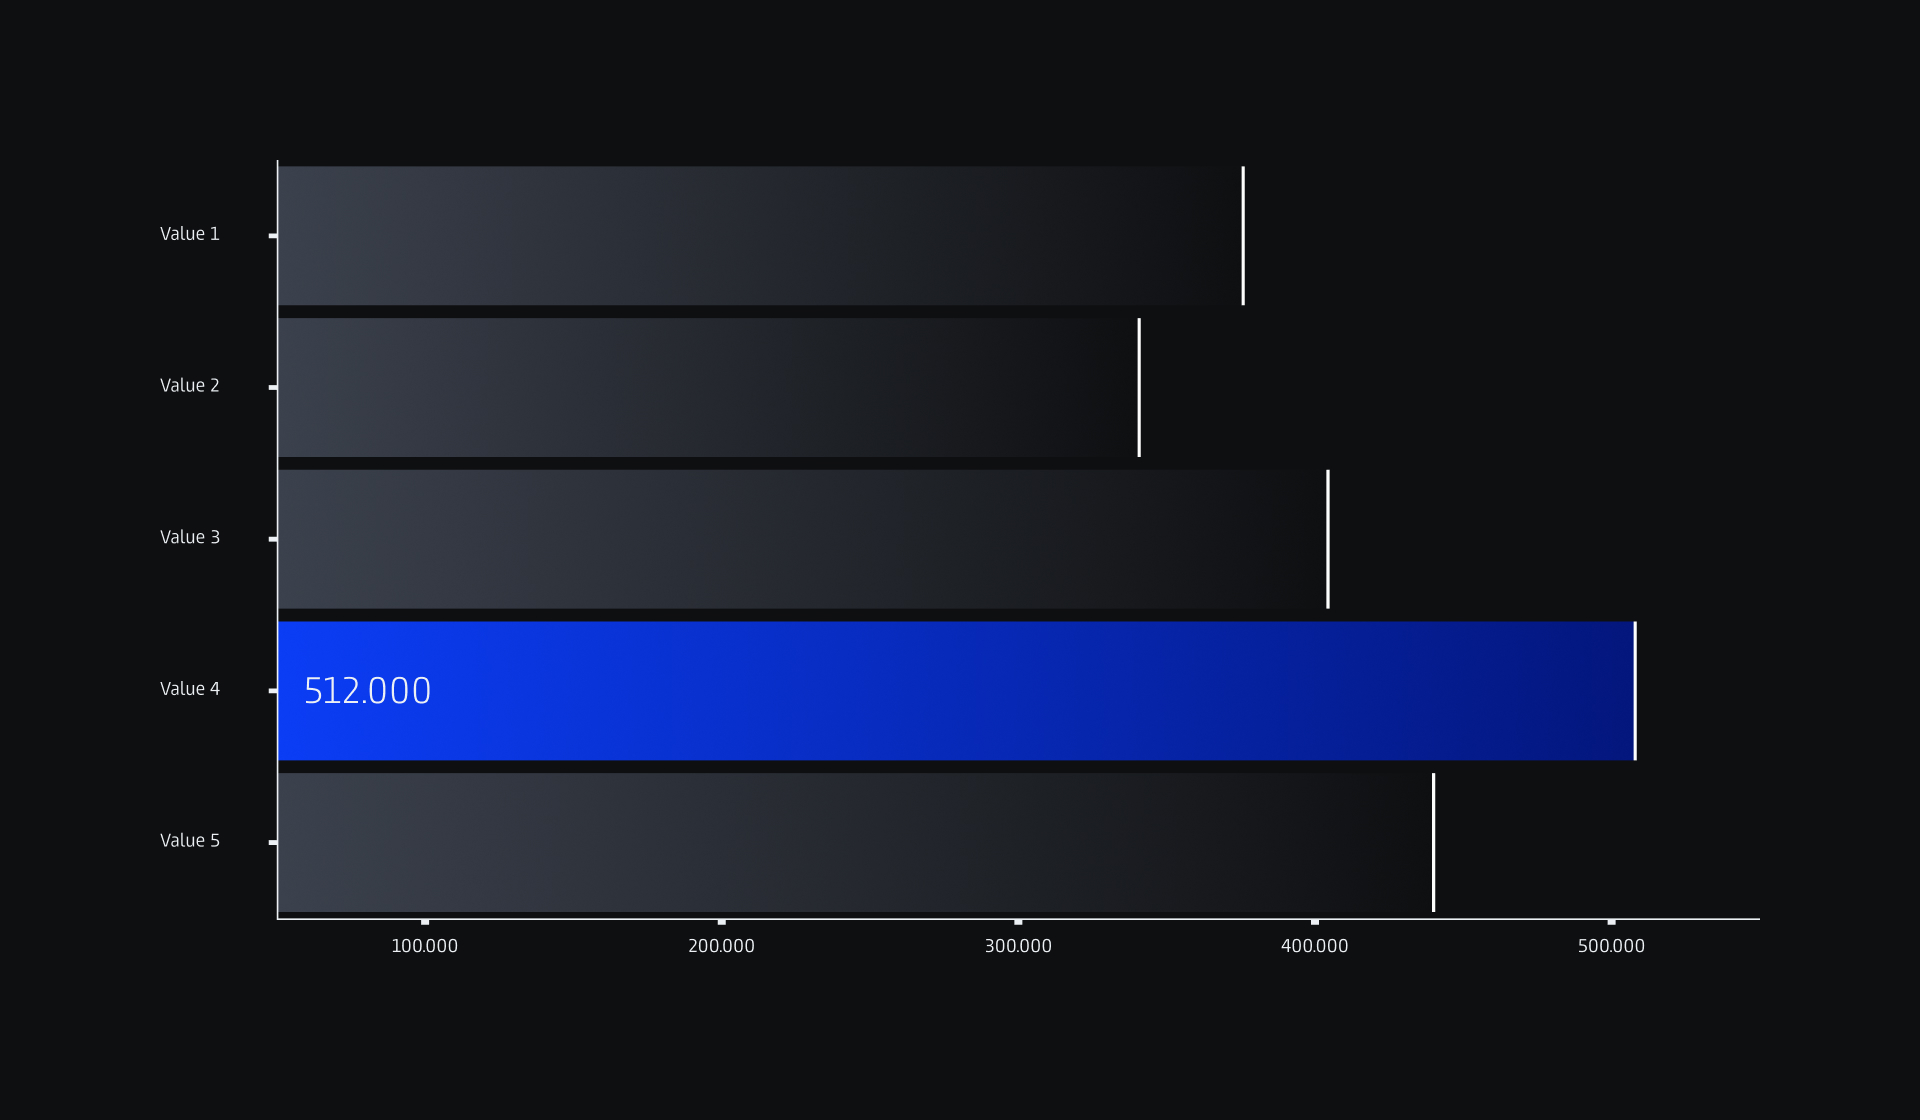
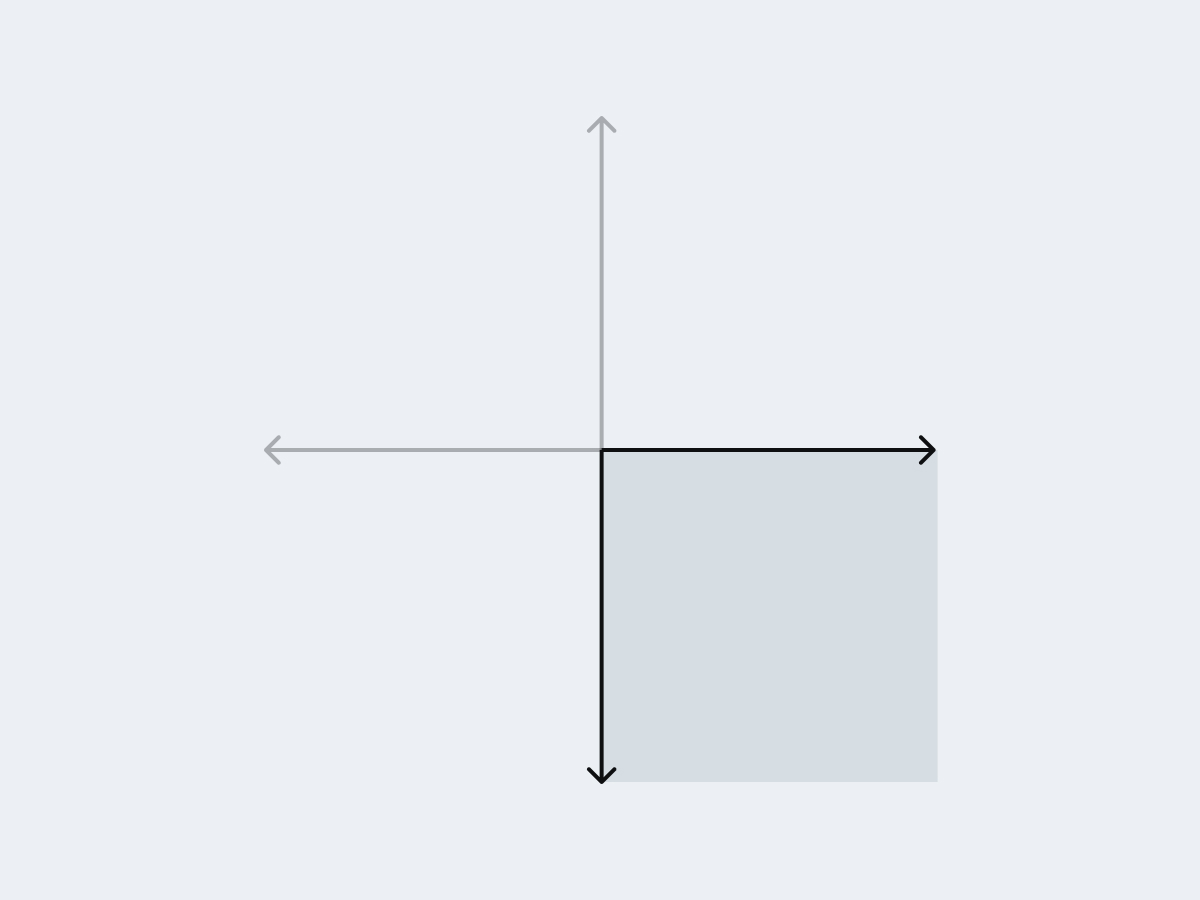
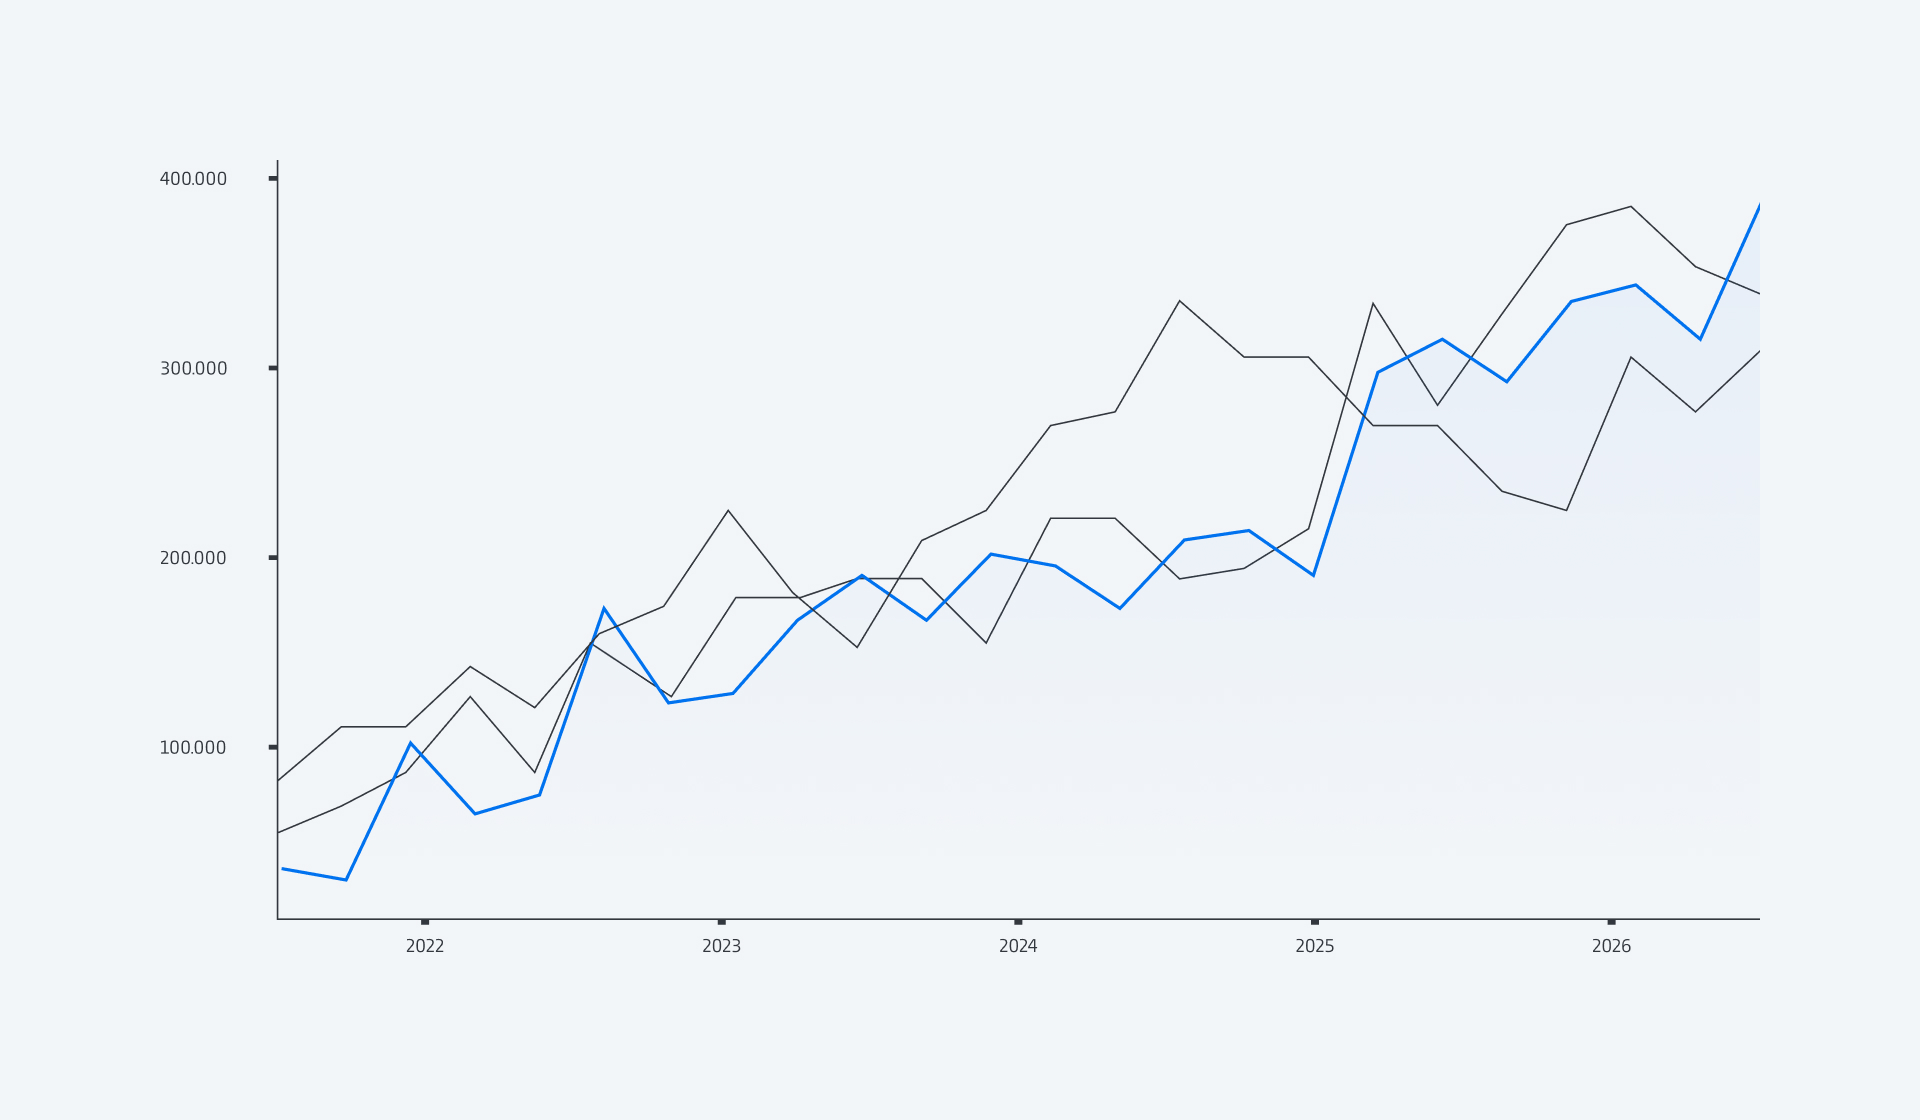
These charts build on the functional minimal design, allowing for more visual elements, data points, and longer titles or explanatory text. They support more detailed analysis while remaining easy to understand.
Highlight a focal point if emphasis is needed.
Corporate Brand, Communications & Public Affairs